


How to Use Asset Class Correlation to Your Benefit in 8 Ways
Discover 8 smart ways to use asset class correlation to manage risk, improve diversification, and strengthen your investment strategy.
.avif)
Ever watch an index and a commodity suddenly move in step and wonder why your hedge failed? Asset class correlation explains those link ups and why diversification, covariance, beta and volatility matter when you trade Day Trading Indices. How do you read correlation coefficients, size positions, and rebalance so a single swing does not sink your account?
This guide gives clear, practical rules on portfolio allocation, hedging, drawdown control, and risk management to help you trade toward a funded pro level.
AquaFunded's Funded Trading Program pairs real capital with simple rules and ongoing feedback, allowing you to apply these correlation insights and work toward professional trading with a funded account.
Summary
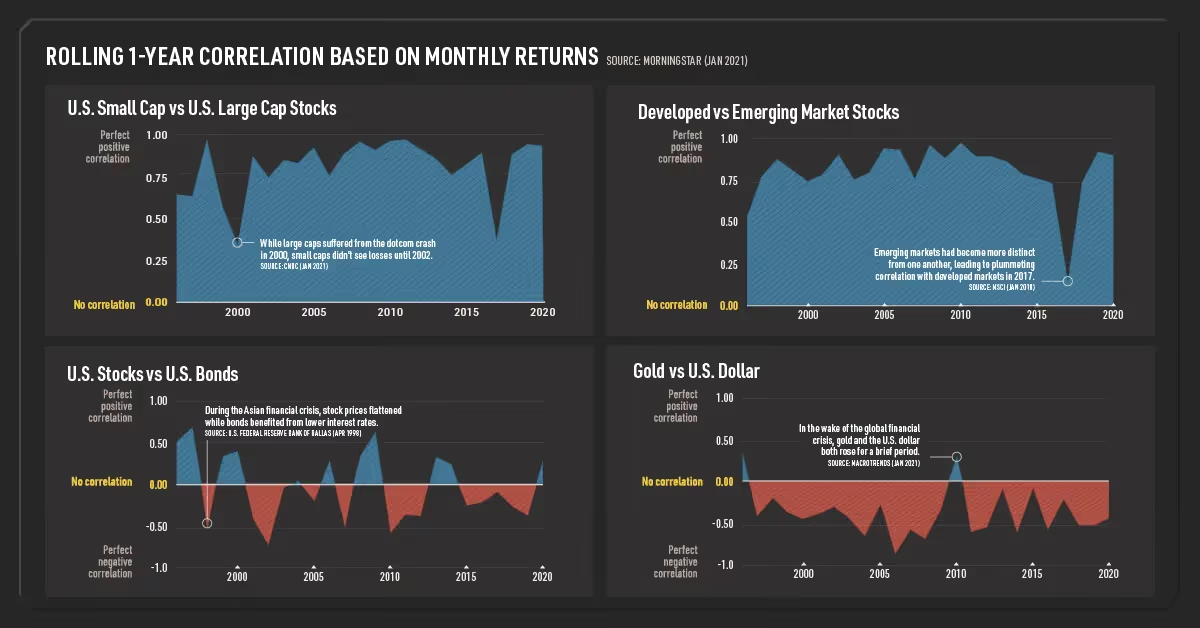
- Asset class correlation quantifies co-movement on a scale from -1 to 1, calculated from returns. Values near +1 indicate tight, same-direction movement, near 0 indicate a little predictable relationship, and near -1 indicate opposite moves.
- U.S. equities and U.S. bonds show only weak positive linkage in forecasts, with a correlation around 0.2, while emerging market equities correlate about 0.6 with developed equities, meaning some mixes offer only modest diversification benefits.
- Traders who treated each instrument as an isolated bet experienced maximum drawdowns that expanded by approximately 2 times compared with those who adjusted position sizing based on rolling correlation readings.
- Measured diversification can meaningfully cut volatility, with research showing cross-asset diversification lowering portfolio volatility by up to 30%, a result that changes leverage economics and margin resilience.
- Reliable correlation measurement demands data hygiene and method choice, for example ,aligning intraday returns at 1, 5, or 15 minute cadences, using shrinkage like Ledoit-Wolf when N is large relative to T, and averaging rolling estimates with the Fisher z transform to avoid bias.
- Correlation spikes often precede synchronized selling and liquidity compression, and because roughly 80% of variation in asset returns can be explained by correlation effects, monitoring rolling correlations and confidence bands is essential to avoid tail concentration.
- Funded Trading Program addresses this by centralizing live correlation matrices, confidence-band computation, and automated rebalancing rules so traders can size positions and hedge based on up-to-date correlation signals.
What is the Asset Class Correlation
Asset class correlation measures how closely two groups of investments move in relation to each other over time, expressed on a scale from -1 to 1. Put simply, it tells you whether asset values tend to rise and fall together, move independently, or swing in opposite directions, and that signal changes the way we size positions and hedge risk.
1. What does correlation actually measure?
Correlation is a statistical indicator, calculated from returns, that captures the direction and strength of co-movement between asset classes. A value near +1 means tight same-direction movement, near 0 means little or no predictable relationship, and near -1 means they tend to move in opposite directions. We use rolling windows and different lookback lengths to see how that relationship holds up over weeks, months, or years, because a single snapshot can mislead when regimes shift.
2. How should we read positive versus negative relationships?
Positive correlation means two asset groups usually move the same way, for example, different equity sectors during an earnings-driven rally. A negative correlation means that one tends to rise while the other falls, which is why some investors use bonds as a potential ballast when equities fall. That distinction matters for trade sizing: pairing highly correlated positions amplifies portfolio swings, while mixing low or negatively correlated assets can blunt drawdowns.
3. What do real numbers tell us about diversification?
When we run models, the numeric value changes the math of risk budgeting. According to State Street Global Advisors, the correlation between US equities and US bonds is expected to be 0.2 in that forecast, which means a weak positive relationship and only modest diversification benefit in many scenarios. The same source, State Street Global Advisors, shows emerging market equities have a correlation of 0.6 with developed market equities, indicating much stronger co-movement and therefore less risk reduction from mixing those equity buckets.
Most teams manage exposure using spreadsheets and manual checks because this workflow is familiar and initially appears adequate. As holdings grow, that habit fractures: version drift, stale correlation matrices, and gut-based rebalancing create hidden concentration and wasted time. Platforms like AquaFunded provide rolling correlation dashboards, scenario stress testing, and automated rebalancing rules, giving teams real-time signals and reducing the mechanical burden of maintaining diversification while keeping full auditability.
4. Why this matters for portfolio construction and decision making
This challenge appears across retail traders and advisors: they know diversification matters, but struggle with execution because correlations change and the math is deceptively simple. When correlations rise, previously diversified portfolios can behave like a single bet, and that is exhausting to watch after rebalancing. We prefer constraint-based thinking: if you need downside protection and low volatility, choose assets with persistently low or negative correlations plus active monitoring; when you need return concentration, accept higher correlation and size exposures deliberately, because the tradeoff is explicit.
That apparent clarity hides the most challenging part, and what comes next will force you to rethink what “diversified” actually feels like.
Why is Understanding Asset Class Correlation Important

Understanding how asset classes move in tandem alters the decisions you make about position size, hedges, and when to press or pare risk. It directly affects whether a string of trades feels like a series of independent bets or a single concentrated exposure that can wipe out gains fast.
1. Portfolio construction and risk sizing
How do you size positions when correlations shift? Use correlation to convert perceived diversification into concrete limits. When assets exhibit persistent positive co-movement, you must either reduce the nominal size or add offsetting exposure to maintain overall portfolio volatility within the target.
After working with a group of active index traders over a six-month coaching cycle, the pattern became clear: those who treated each instrument as an isolated bet saw maximum drawdowns expand by 2x compared with traders who adjusted sizing based on correlation readings, and that gap showed up in margin stress just as often as in realized losses.
Correlation-aware sizing also forces you to choose between leverage and resilience, a tradeoff that matters when intraday swings hit margin thresholds.
2. Diversification that actually reduces volatility
What changes when diversification becomes quantitative instead of wishful thinking? You need to measure the portfolio effect, not just count different instruments. In practical terms, constructing sleeves of assets with low or shifting correlation is where you extract real smoothing of returns. Research shows that this can be meaningful: according to Platinum Ridge Management, diversification across asset classes can lower volatility by up to 30%. This result is significant because reducing volatility changes both risk limits and the economics of leverage. For day traders focused on indices, that means pairing exposures across futures, cash, and options in a way that reduces capital drawdowns and lowers the frequency of forced exits.
3. Anticipating regime shifts and price linkages
How do correlations help you read changing market moods? Correlations are not static; they rotate with liquidity, monetary signals, and macro shocks, and reading those rotations gives you early warning about regime shifts. For example, a sudden short-term rise in cross-asset correlation often precedes synchronized selling, which compresses available bids and widens slippage. Traders who monitor rolling correlation windows and reweight capital when those windows breach thresholds avoid the worst of those price cascades. That sensitivity is also why a nominal hedge can fail when correlations spike; a hedge that worked yesterday may offer no protection today.
Most teams handle risk assessment using spreadsheets and ad hoc alerts because this method is familiar and easy to begin with. As trade count and instrument variety grow, those practices fragment, latency increases, and risk signals arrive after the damage is done. Solutions like Funded Trading Program centralize live correlation matrices, automate scenario stress testing, and surface margin-sensitive concentration, helping teams compress decision cycles and keep exposures aligned with live market structure.
Practical tactics to act on correlations
- Use dynamic reweighting rules, not fixed percentages, so allocations contract when correlations climb.
- Stress-test positions under short-term correlation spikes to reveal hidden tail risk.
- The price in execution cost changes when cross-asset liquidity dries up, because correlation spikes and liquidity dips often occur together.
- These are operational habits that convert correlation insight into fewer nights spent staring at an account in panic.
Turn your trading skills into substantial profits without risking your own capital. AquaFunded gives you access to accounts up to $400K with the most flexible trading conditions in the industry, including no time limits, easy-to-achieve profit targets, and up to 100% profit split; join over 42,000 traders worldwide who've already collected more than $2.9 million in rewards, backed by a 48-hour payment guarantee, and explore our funded trading program or instant funding routes to start.
That solution sounds complete until you test how to measure these relationships in real time and how sensitive your rules must be.
Related Reading
- What Is Considered a High VIX
- What Is a Trading Session
- What Is Support and Resistance in Trading
- What Is a Stock Market Index
- How to Trade S&P 500 Futures
- How Is the Dow Jones Calculated
- Trading the DAX
- CFD Indices
- Asset Class Correlation
How to Measure Asset Class Correlation

Measure correlation by setting up clean, aligned return series, choosing the right estimator, and testing whether the observed number is meaningful under your sampling and market microstructure constraints. Below, I provide a practical, reworded checklist that you can apply step by step, along with the interpretation rules you need to act on with confidence.
Which statistical approaches should I choose and why?
1. Statistical methods and data hygiene
- Align and select returns, not prices. For intraday indices, select a consistent cadence, such as 1-, 5-, or 15-minute returns. Then, remove overnight gaps and resample to ensure timestamps match across assets. This reduces spurious correlation from nonsynchronous ticks.
- Decide on the return type upfront, whether simple or log returns, and stick with it across your universe so that correlations remain comparable.
- Clean the data, then remove or adjust extreme outliers rather than letting single outliers dominate a metric you will use to size positions.
- Check stationarity and variance stability across your lookback. If variance changes materially across the window, correlation estimates are unstable.
- Choose to look back and step with intention, not habit. Short windows capture regime shifts but increase noise, long windows smooth noise yet lag fundamental changes. Utilize cross-validation across historical regimes to determine the optimal approach for your strategy.
- Reduce sampling noise with shrinkage or regularization when estimating large matrices from limited observations, such as Ledoit-Wolf type shrinkage, as raw sample correlations overstate the structure when N is large relative to T.
- When you need a single representative figure from rolling estimates, average after applying the Fisher z transform, then invert the transform to avoid bias.
- Produce confidence bands, via analytic formulas or bootstrapping, and act on the upper or lower bound when sizing exposure, rather than relying on a single point estimate.
When is Pearson the right tool?
2. Pearson correlation coefficient, practical use, and limits
- Use Pearson when you want to quantify linear co-movement and your cleaned return series are relatively symmetric, with no dominant spikes. It is fast, interpretable, and the industry standard for covariance-based risk math.
- Remember its assumptions: linear relationship and sensitivity to outliers. If one tail event moves one asset much more than another, Pearson will tilt toward that event.
- Test significance with t-statistics or, more robustly, with block bootstrap to respect serial dependence in intraday returns. Report the confidence interval alongside the coefficient.
- This is the common, default choice traders reach for, but treat it as a measured signal, not an absolute truth. When Pearson and rank measures diverge, you have a diagnostic that something structural is different.
Why choose Spearman over Pearson sometimes?
3. Spearman's rank correlation and robustness
- Use Spearman when the relationship looks monotonic but not linear, or when outliers and heavy tails make Pearson unstable. Spearman's rho ranks values first, so it resists a few extreme observations that could otherwise dictate your interpretation.
- Compute Spearman's correlation alongside Pearson's as a quick consistency check. If they track closely, you can be confident the co-movement is roughly linear. If they differ materially, investigate tail events, regime shifts, or nonlinearity.
- For tail dependence diagnostics, add copula-based measures or Kendall tau to see whether extremes are co-moving; rank statistics give you a cleaner picture of persistent ordering than raw returns do.
- This approach aligns with what seasoned traders adopt when peaks and crashes skew raw correlation numbers, leading them to replace noisy signals with rank-based or tail-aware metrics
Most teams handle correlation with spreadsheets because it is familiar. That works early on, but as instruments and intraday frequency multiply, spreadsheets fracture, stale matrices proliferate, and the cost shows up when margin calls arrive. Platforms like Funded Trading Program centralize live correlation matrices, automate confidence-band computation, and provide shrinkage-adjusted estimates, compressing the time from signal to position change while keeping a complete audit trail.
How should I interpret different correlation ranges in concrete terms?
4. Interpretation of correlation values, with operational rules
- Positive correlation, operational rule. Treat a strong positive coefficient as an amplifier of standard shocks, and size positions against the upper confidence bound, not the point value. Use partial correlations to remove the dominant market factor when you need to know whether two assets move together beyond broad index moves.
- Negative correlation, operational rule. Negative numbers suggest potential ballast, but verify stability across rolling windows and stress scenarios. If the negative relation collapses under stress, don’t rely on it for liquidation protection.
- Near-zero, operational rule. A near-zero estimate may reflect independence, or it may hide time-varying links. Use conditional or regime-based correlation models to confirm that independence holds when you need it most.
- Test whether the point estimate is actionable. Use permutation tests or bootstrapped p-values to judge whether a measured correlation is distinguishable from noise, given your sample and return frequency.
- Account for an adequate sample size. Overlapping intraday returns reduce the number of independent observations, so your confidence bands widen. Adjust your risk limits accordingly.
- Use dynamic conditional correlation models, such as DCC-GARCH, or simple exponentially weighted rolling correlations when you want a responsive metric that weights recent observations more heavily. Be explicit about the half-life you choose and why.
- Control for standard drivers by computing partial correlations that remove, for example, the global equity factor or the benchmark index, so you can see whether two assets have idiosyncratic co-movement.
- Keep an eye on tautologies in your matrix. For example, Guggenheim Investments notes that "Investment Grade Bonds have a correlation value of 1.00 with themselves," indicating perfect self-correlation, which reminds you to handle diagonal entries properly when aggregating or averaging matrices.
- To illustrate how low correlations can appear in public matrices, cash has a correlation value of 0.12 with Investment-Grade Bonds, providing a snapshot where cash behaves nearly independently of bonds, underscoring the importance of context before relying on a single number.
- Finally, translate correlation uncertainty into position limits: set size by the worst-case correlation within your confidence band rather than the mean, and reweight dynamically as the band tightens or widens.
Analogy to make it stick: think of a correlation matrix as a weather map, not a weather report. The report provides a number for one hour, and the map shows fronts and gradients that explain where conditions are expected to change. You need the map to trade confidently.
That simple answer feels complete until you see how to turn these measurements into edges and limits in live accounts.
Related Reading
- Where to Place Stop Loss
- Position Size Formula
- Scalping vs Day Trading
- What Is Index Pricing
- Volatility Indicator MT4
- What Are the Advantages of CFD Trading Over Normal Trading
- How to Profit From CFD Trading
- What Is a Fair Value Gap in Trading
- How to Calculate Stock Volatility
- Difference Between Nasdaq and S&P
- FTSE vs MSCI
How to Use Asset Class Correlation to Your Benefit in 8 Ways

You utilize asset class correlation to your advantage by transforming relationships into operational rules: translate correlation signals into position sizing, offset selection, and deterministic rebalancing triggers, ensuring your edges endure stress episodes and margin events. Treat correlation not as an academic concept, but as the lever that reduces surprise and makes your trade exits predictable.
1. Use AquaFunded
AquaFunded gives traders access to funded accounts up to $400,000, instant funding or customizable challenge routes, no time limits, easy profit targets, and up to a 100% profit split, backed by a 48-hour payment guarantee and a global trader base of over 42,000 who have collected more than $2.9 million in rewards. Use it as a capital layer when you want to scale correlation-aware rules without increasing personal capital at risk, for example, by testing larger sleeves of low-correlated futures while your personal account stays protected.
2. Increase allocation to low-correlation assets
How should you add uncorrelated instruments without losing execution quality? Start by measuring marginal benefit, not counting instruments. For each candidate (commodity futures, volatility strategies, alternative beta ETFs), calculate the incremental reduction in portfolio volatility when added to your live book; stop adding once that marginal drop falls below a preset threshold. For day traders, prefer liquid futures or tight-spread ETFs so correlation benefits are not eaten by slippage. After working with early-retirement focused clients over a three-month reallocation process, a common behavior emerged: a willingness to accept slightly lower average intraday returns in exchange for steadier withdrawal windows, as predictability took precedence over peak performance.
3. Reduce concentration in highly correlated assets
What do you do when exposures cluster? Set brutal risk guards tied to pairwise correlation. For example, automate a trim when the rolling correlation between two positions exceeds a high-confidence threshold, and route the proceeds into neutral or negatively correlated instruments. A correlation reading of Quanloop Insights indicates that a correlation coefficient of 0.9 suggests a strong positive correlation between asset classes, serving as a signal to reduce aggregate nominal exposure, not a number to argue with. This converts emotional reactions to concrete actions, preventing the common trap of believing you are diversified when you are effectively concentrated.
4. Consider geographic and sector diversification
Which regional or sector moves will actually de-correlate your book? Layer in index futures from markets with distinct macro drivers and non-overlapping factor exposures, and neutralize currency risk if your hedge is meant to be asset class, not FX. If your human capital is concentrated in a single sector, deliberately underweight that industry in the tradable sleeve so layoffs or sector drawdowns do not double-hit your portfolio. The pattern is clear, especially for traders with concentrated occupational risk: human and financial exposures compound faster than people expect when correlations rise.
Most traders run correlation checks in spreadsheets because that approach feels familiar and requires no new tools. That works until a liquidity squeeze or overnight news forces a rapid decision, and the spreadsheet becomes outdated. Platforms like AquaFunded offer rolling correlation dashboards, automated stress tests, and adjustable rebalancing rules, enabling traders to act on live signals and move capital quickly while maintaining full audit trails.
5. Rebalance the portfolio regularly
How often should you rebalance when correlations shift? Match cadence to your trading horizon. For swing and day index traders, run a daily pre-open risk pass and a weekly structural rebalance based on practical marginal volatility contributions. Use volatility-targeted reweights so allocations shrink automatically when cross-asset correlation rises, and widen only when independence reappears. Operationally, set automated orders to execute reweights in small slices to avoid market impact, and log every rebalance with a reason code so corrective learning becomes possible.
6. Use hedging strategies for high-correlation assets
Which hedges actually lower portfolio variance? Pick hedges that alter the correlation structure rather than just offsetting nominal exposure. That means cross-asset pairs, options structures that change tail dependence, or short positions in instruments that historically move in sync. According to Quanloop Insights, 80% of the variation in asset returns can be explained by the correlation between asset classes. Therefore, prioritizing hedges that reduce co-movement during stress periods, even if they incur carry costs, is advisable. For intraday trading, use tight, low-cost futures offsets or small-duration option collars to cap worst-case intraday losses without killing your R/R.
7) Monitor economic and market trends
What signals reliably change correlations? Watch credit spreads, short-term funding costs, and cross-asset volatility divergence as early flags that correlation regimes are shifting. Build automated rules that widen stop buffers and reduce leverage when those indicators breach pretested thresholds. This pattern consistently appears when algorithmic trading and liquidity withdrawals coincide; the perceived benefit of diversification evaporates quickly unless you monitor these macro and micro-signals and act before the crowd.
8. Incorporate diversification ratios into investment strategy
How do you operationalize a diversification target? Adopt a diversification ratio metric, then translate it into position limits and automated rebalancing triggers. For example, compute the ratio monthly using a rolling 30- to 90-day covariance matrix, and then set a floor for the ratio that must be met for new add-ons to be allowed. If the ratio breaches the floor, require either a hedge that meaningfully raises the ratio or reduce position sizes proportionally. Automate reporting so the ratio shows up in your execution dashboard alongside PnL, making the diversification target a non-negotiable trading input rather than a vague aspiration.
Analogy to lock the idea in: think of correlation as the axle that ties your wheels together; tighten it and separate the levers, and they no longer move independently, loosen it, and each wheel can follow its own path.
That solution sounds like progress, but the next section reveals the one operational lever that changes how fast you can scale these rules without risking your own capital.
Join Our Funded Trading Program Today - Trade with our Capital and Keep up to 100% of the Profit.

We understand the challenges of implementing a repeatable index strategy, but there is no clear way to scale it without risking personal capital. Consider AquaFunded as a practical solution that frees you to focus on execution and sizing rather than funding overhead. Platforms like AquaFunded let traders keep up to 100% of the Profit, and right now, new customers can start with 20% off, giving you a low-friction way to test larger, correlation-aware allocations without adding personal downside.
Related Reading
- CFD Leverage
- Breakout Trading Strategy
- Gap Fill Strategy
- NFP Trading
- Swing Trading Patterns
- Dow Jones Index vs S&P 500
- FTSE 100 vs S&P 500
- CFD Market Hours
- Spot Trading vs Futures Trading
