


What Is Support and Resistance in Trading
Discover what Support and Resistance in Trading mean, how to identify them, and why they’re key to smarter market entry and exit decisions.
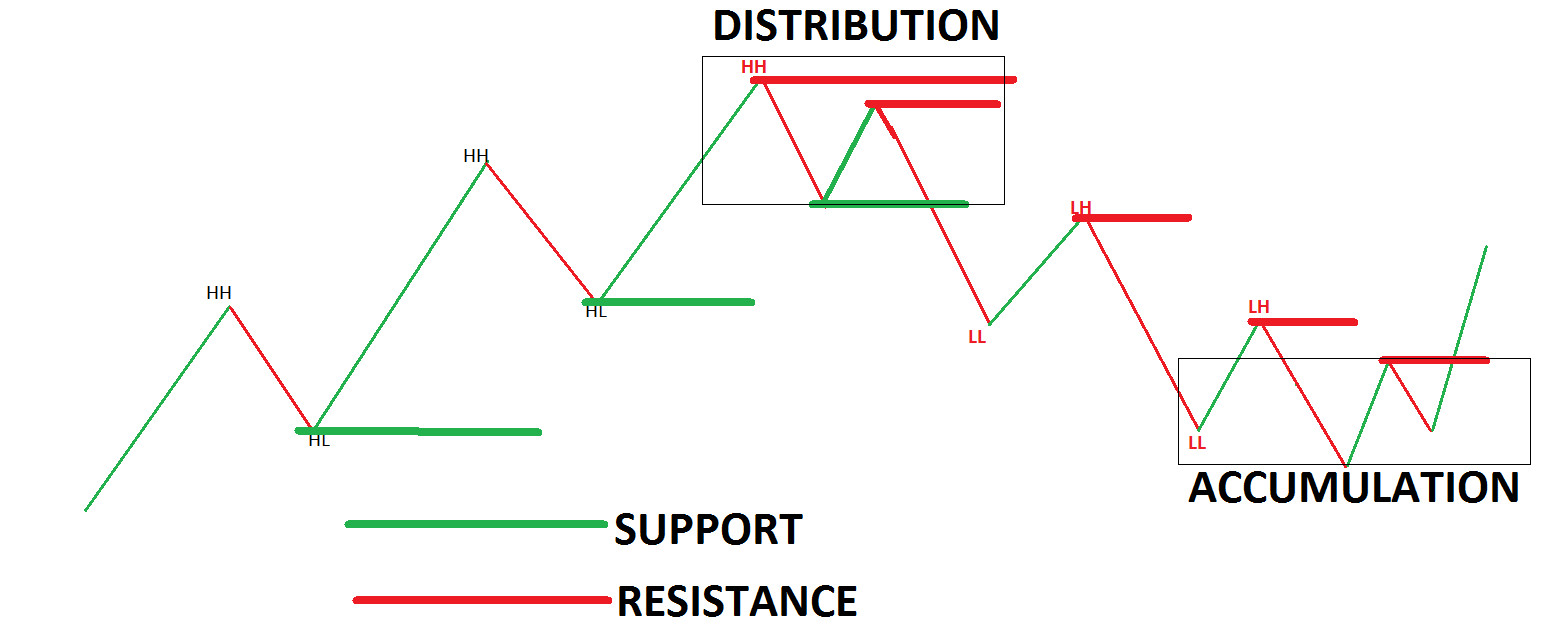
When an index stalls at the same price level, that repeated pause becomes a clue every Day Trading Indices trader can use. Support and resistance are price levels, trend lines, and pockets of supply and demand that indicate where breakouts, pullbacks, and trend reversals may occur; by reading price action, chart patterns, and order flow, you can pick entries, exits, and stop-loss targets.
This guide provides clear rules and chart examples to help you trade consistently and move toward pro trading with a funded account.
AquaFunded's Funded Trading Program helps you turn those skills into the capital and real account experience needed to trade professionally. It provides a straightforward evaluation path, funded capital upon qualification, and support so you can focus on entries, risk management, and performance.
Summary
- Support and resistance turn ambiguous price action into repeatable decisions you can size and time, with over 70% of traders relying on these levels and the same work appearing in about 80% of technical analysis approaches.
- Stops and risk are part of market structure, not guesswork, and many traders use practical heuristics, such as placing stop-loss orders roughly 5% below support as a starting point.
- Stacking timeframes and seeking confluence raise trade quality, as research shows that about 70% of successful trades are based on identifying key support and resistance levels.
- Formalized, repeatable rules accelerate execution and reduce hesitation, for example, logging at least 50 trades per rule and adopting one entry and one exit template, a practice that has helped traders double decision speed.
- Guard breakout entries with objective checks, requiring three conditions: expansion in range, clear volume or order flow participation, and a holding retest or multi-timeframe confirmation to avoid false breakouts.
- Mapping clustered zones turns randomness into a routable plan for position sizing and session management, and traders report a roughly 60% increase in accuracy when support-and-resistance work is applied consistently.
- This is where AquaFunded's Funded Trading Program fits in, providing funded capital and standardized risk templates so traders can practice larger-size execution under consistent rules.
What Is Support and Resistance in Trading

Support and resistance are chart-based price zones traders rely on to place trades and manage risk; support is where buying pressure tends to halt declines, and resistance is where selling pressure tends to stall rallies. You use them to time entries, size risk, and decide whether a breakout is real or likely to fail.
How do you recognize support in the moment?
1. Support, explained as a practical buying zone.
Price reaches a level, buyers gather, and downward momentum slows or reverses. That level can be a prior swing low, a trendline touch, a moving average, or a round number where orders cluster. You watch for price action confirmation, such as a quick-rejection candle, rising volume into the zone, or confluence with the VWAP or a 50-period moving average.
This is where traders often place entry zones and risk controls, and many use simple rules to avoid analysis paralysis; this pattern appears across novice intraday setups and seasoned day traders who tighten their setups by focusing on these core levels rather than dozens of noisy indicators.
Why does resistance form, and how should you trade it?
2. Resistance, described as a selling zone that caps advances.
When an uptrend reaches a price where sellers step in, supply overwhelms demand, and the advance pauses or reverses. Resistance can be a prior high, the top of a congestion area, or a level where option strikes or institutional sells concentrate. Traders monitor how the price behaves at resistance for clues: a slow grind higher with low volume suggests exhaustion, while a sharp rejection with wide bars signals a strong supply zone and a potential short or fade. Remember, a clean break of resistance can flip into reliable support, but false breakouts are common when there is no follow-through volume.
How do traders actually use these zones as part of a plan?
3. Entry, stop, and target rules around these zones.
You define an acceptable trade based on where the price reacts: enter on a confirmed bounce or breakout, place a stop beyond the level to account for noise, and set targets at the next obvious opposing zone or measured move. Many traders codify this into repeatable templates so decisions are quick and unemotional; that discipline is what separates consistent PnL from luck. According to Investopedia, 50% of traders use support and resistance levels to make trading decisions, which explains why these horizontal zones often become self-reinforcing in live markets. For risk placement, many traders follow the common heuristic noted by Investopedia. Traders usually set stop-loss orders 5% below support levels, treating that as a practical starting point for intraday sizing.
What breaks when you rely on them the wrong way?
4. Failure modes and how to avoid them.
Treating a single line as sacred is a mistake because levels are probabilistic, not absolute. Problems arise when traders crowd too many levels on a chart, or when they ignore context such as time frame, liquidity, or news catalysts. The typical failure is paralysis from indicator overload; simplify by using one or two confirmations, such as VWAP plus a swing low or a moving average, and discard the rest. When you make decision rules explicit, you remove hesitation and prevent emotional over-trading.
Most traders follow the familiar habit of drawing lines by hand because it is immediate and feels intuitive. That works at first, but as you scale trade frequency and monitor more instruments, manual marking creates inconsistency and slower reaction times, which costs entries and increases slippage. Platforms like AquaFunded provide automated detection of clustered levels, overlay confirmations against VWAP and moving averages, and prebuilt risk templates, so traders can standardize entries and stop placement while cutting setup time and execution latency.
Think about support and resistance like traffic control for price: sometimes the road slows, sometimes it clears, and your job is to read the signs and choose the right lane.
That simple map hides a consequence most traders miss, and it changes how every decision should be timed.
Related Reading
- What Is Considered a High VIX
- What Is a Trading Session
- What Is a Stock Market Index
- How to Trade S&P 500 Futures
- How Is the Dow Jones Calculated
- Trading the DAX
- CFD Indices
- Asset Class Correlation
Importance of Support and Resistance in Trading

Support and resistance matter because they turn ambiguous price action into repeatable decisions you can size, time, and manage, and sharpen your edge when combined with clear confirmations. Used well, they let you plan trades where probability, not luck, does the heavy lifting.
1. What do support and resistance actually signal about order flow?
Support and resistance are the places where buyers and sellers queue up, not fixed lines but pooled liquidity zones that attract attention from multiple market participants. Read them as concentration points where stop orders, limit orders, and option strikes cluster; that explains why the price often hesitates or accelerates there. This view makes level-drawing a tool for anticipating where order flow will change, and it changes how you think about timing, since you are following where real capital pools.
2. How do these zones give you higher-probability reversal points?
Treat a tested zone as a statistical edge. When price revisits a respected area and you have a clean price-action signal, the odds shift in your favor because multiple participants are reacting to the same cue, according to Investopedia, 70% of successful trades are based on identifying key support and resistance levels, which highlights why disciplined level work shows up repeatedly in winning trade tapes.
3. How should zones shape exact entries and exits?
Use levels to define an entry envelope, not a single tick. Enter on a confirmation pattern that fits your time frame, then anchor your exits to the next opposing zone or a measured move that respects recent volatility. When you think in envelopes and probabilities, you stop hunting for perfection and start capturing consistent edges, which is what separates repeatable strategies from guesswork.
4. Where do you place stops and profit targets without guessing?
Stops should sit beyond the level’s noise, sized to the market’s typical intraday swing, and your personal risk tolerance. At the same time, profit targets should align with the next obvious supply or demand cluster so you bank gains where the market historically pauses. This approach reduces emotional exits and turns trade management into a rule-based system rather than an impulse-driven exercise.
5. Why does the time frame you draw on change a level’s power?
Levels drawn on larger time frames concentrate more orders and attention, so they typically hold more weight under stress. That means a level seen on the daily chart will elicit different reactions than one visible only on a 5-minute chart. This is why you should prioritize confluence across time frames, letting the higher-frame zone set the bias and the lower-frame action fine-tune the trigger, not the other way around.
6. How do you detect early trend shifts through levels?
A break that happens with expansion in range and follow-through volume signals a genuine shift in supply and demand, and often marks the start of a new trend phase. Watch how price retests a broken level; a successful retest that flips the role confirms the shift, while a failure to retest or a fast reversal warns of a false breakout. That distinction is between protecting capital and handing it back to the market.
7. What practical edge does mapping key zones give you beyond single trades?
Mapping clustered zones turns randomness into a repeatable map for position sizing, session planning, and risk budgeting, because you can compare the distance to your stop against the distance to the target and then size accordingly. This lets you plan multiple setups per session with consistent expected value, instead of one-off bets that depend on hope.
This challenge appears across intraday accounts and small prop teams: traders use levels but treat them as precise barriers rather than probabilistic zones, which leads to overtrading and avoidable losses. It feels familiar because drawing lines is immediate, but the hidden cost is inconsistent execution when volatility or news expands; platforms like AquaFunded provide automated level clustering, configurable risk templates, and quick execution overlays so traders can standardize entries, stops, and position sizing without losing time or discipline.
After working with active day traders, the pattern is clear: uncertainty about exact timing causes missed entries and late stops, which is why a repeatable rule set for levels and confirmations improves consistency more than adding new indicators. That practical change reduces second-guessing and keeps PnL decisions mechanical rather than emotional.
Turn your trading skills into substantial profits without risking your own capital with AquaFunded’s funded trading program, offering instant funding, customizable challenge paths, and flexible trading conditions. AquaFunded gives access to accounts up to $400K, no time limits, easy profit targets, up to 100% profit split, and fast payouts backed by a 48-hour guarantee.
That solution sounds tidy, but the part that traders underestimate will surprise you.
Support and Resistance Level Trading Strategies

These six practical setups give you a clear, repeatable plan for trading around key price zones, specifying the trigger, where to place risk, and a sensible profit target for each. Read them as rules you can test mechanically, not opinions to argue about.
1. Bounce Trading, a reversal entry
Goal, rephrased
Take a position when price meets a tested zone and visibly rejects it, capturing the counter-move.
How to trade, stepwise
- Mark a well-respected horizontal zone seen on higher timeframes and that has held multiple times.
- Wait for the price to enter that zone, then look for a clean rejection candle, such as a long-tailed hammer, pin, or an engulfing move, that shows the sellers/buyers lost the immediate battle.
- Enter with a limit or a market order in the direction of the rejection, after the confirmation bar closes.
Risk control
Put the stop just beyond the outer edge of the zone so brief noise does not trigger you.
Profit plan
Target the next logical zone in the opposite direction or scale out as momentum slows.
Concrete example
A tested support near 2,450 is followed by a sharp wick down and a bullish engulfing bar. You buy near 2,455, stop below 2,440, and plan to exit near 2,540.
2. Breakout Trading, capture momentum on the run
Goal, rephrased
Jump into moves when price forces its way past a significant level and follow the resulting momentum expansion.
How to trade, stepwise
- Identify a level with repeated tests and narrow the range into that test.
- Require a decisive candle close beyond the level, ideally with increased volume or momentum confirmation, such as RSI above 60.
- Enter after the breakout candle closes to avoid immediate false-break noise.
Risk control
Place the stop below the breakout candle body for longs, above for shorts.
Profit plan
Use the height of the prior congestion and project it from the breakout point as your first target; let a portion run if volume continues.
Concrete example
Resistance at 3,320 yields a clean close at 3,335 with a higher range and substantial volume. Buy at 3,340; stop at 3,300; target 3,420.
3. Breakout–Retest Trading, patience before conviction
Goal, rephrased
Wait for a breakout, then a rehearsal, using the retest to avoid chasing false moves.
How to trade, stepwise
- Watch for a true breakout, then be prepared to step aside.
- Let price pull back to the broken level and form a visible hold, such as a small-range consolidation, a pin, or a quick rejection at the retested line.
- Enter when that retest shows rejection, sizing objectively.
Risk control
Stop slightly beyond the retest pocket rather than the original breakout wick.
Profit plan
Use either the next horizontal zone or a risk/reward of one to two as your exit framework.
Concrete example
A resistance at 210.00 breaks, price returns, and forms a short-bodied rejection near 210.25. You enter long at 210.60, set a stop under 209.40, and target 218.00.
An analogy to feel it
A retest is like a door pushed open, then nudged gently to see if it stays; if the hinge holds, you walk through.
After trading many intraday setups with active traders over several months, one pattern became obvious: complexity often creates hesitation. Most traders still mark levels by hand and patch together confirmations, which works early on but becomes inconsistent as speed and instrument count increase. Platforms like AquaFunded change that dynamic by automating clustered-level detection, overlaying order-flow context, and providing standardized risk templates, helping traders move from ad hoc judgments to consistent execution without losing situational awareness.
4. Range Trading, profit inside clear boundaries
Goal, rephrased
Trade back-and-forth while price respects a horizontal channel, aiming for multiple small wins rather than guessing a breakout.
How to trade, stepwise
- Select instruments with clear, sustained sideways movement and draw parallel boundaries.
- Buy near the lower boundary and sell near the upper boundary, confirming with oscillators that the market is oversold or overbought.
- Avoid entries near the channel extremes when volatility contracts sharply; that often signals an imminent breakout.
Risk control
Place stops just outside the channel so occasional tails do not wipe you out.
Profit plan
Take profit on the opposite side of the channel or scale out as price approaches the target.
Concrete example
Instrument oscillates between 1.3300 and 1.3500; buy near 1.3330 with a stop below 1.3300, take profit near 1.3490.
5. Trendline Trading, riding the slope of momentum
Goal, rephrased
Use diagonal support or resistance lines to force entries in the direction of an established trend.
How to trade, stepwise
- Draw a trendline across at least two reliable swing points on a higher timeframe to give it weight.
- Wait for pullbacks that touch the trendline, and demand a clear price-action bounce or confirmation candle before committing.
- Use lower-timeframe setups to achieve tighter entries and improve execution.
Risk control
Place stops below the last swing low in uptrends or above the previous swing high in downtrends.
Profit plan
Aim for nearby horizontal resistance in the trend direction, or trail stops to protect winners.
Concrete example
Uptrend with rising trendline touched three times, a bullish pin forms on the pullback, enter long with stop below the recent swing low, and target the next horizontal resistance.
6. Multi-Timeframe Confluence, stack the odds
Goal, rephrased
Combine higher-frame bias with lower-frame entry precision to reduce noise in the bigger picture.
How to trade, stepwise
- Identify primary support or resistance on the daily or 4-hour chart to set bias.
- Drop to a one-hour or 15-minute chart to find an efficient entry pattern that aligns with that bias.
- Only take triggers that match the higher timeframe direction; if they disagree, step aside or reduce size.
Risk control
Size based on distance to the stop on the lower timeframe, while respecting the higher-frame zone.
Profit plan
Use the next higher frame level as a logical take profit, or scale out with a trailing rule.
Concrete example
The daily chart shows strong upper resistance; on the 1-hour chart, wait for a bearish engulfing at that same horizontal, then short with a stop beyond the daily zone.
Why it helps
When you stack timeframes, you cut false signals and increase the probability per trade, a practice that aligns with how most active traders allocate attention, as evidenced by Trading Shastra Academy's finding that over 70% of traders use support and resistance levels to make trading decisions. That prevalence explains why level work becomes self-reinforcing in live order flow.
Practical refinements that matter
- Favor a single, repeatable confirmation rule per strategy, and log its outcome for at least 50 trades before assuming it works. This forces discipline and reduces the fatigue of endless backtests.
- Use order flow or footprint reads when available to see whether passive limit orders are building in your zone, and avoid blind entries into thin liquidity.
- If you combine indicators, keep them orthogonal. For example, pair an oscillator for momentum extremes with a volume-based filter, not two oscillators that tell the same story.
- Expect setup failure, and track why each trade lost: poor level draw, ignored news, or execution lag. Traders who catalog these root causes refine faster, and many report real gains; in fact, Trading Shastra Academy's 2025 note that traders report a 60% increase in accuracy when using support and resistance levels shows why disciplined level work pays off when practiced consistently
A short analogy to close this part: good level work is like a well-marked runway; it does not guarantee a perfect landing, but it gives you a repeatable approach and a clear path to stop or go.
That tidy checklist feels complete until you discover the single execution habit that flips these rules from theory to real edge.
How to Use Support and Resistance in Trading

You use support and resistance as practical triggers for four trade actions plus a funded-capital option, each with clear rules for order type, confirmation, and risk. Below, I give five concrete, reworded tactics you can apply immediately, with execution details that go beyond simple bounces and breaks.
1. Use AquaFunded
AquaFunded turns skill into a scalable opportunity without using your own capital, offering funded accounts up to $400,000, flexible challenge paths, and instant funding, with payout terms that let traders keep up to 100 percent of profits while payments clear quickly. Traders already using this model report faster portfolio scaling because they can test larger executions under realistic conditions without the personal drawdown stress that would otherwise distort decision-making.
2. Take-profit planning: where and how to lock gains
How should you decide when to harvest a winner? Treat profit targets as pre-mapped exit zones tied to visible order-flow cues, not guesses. Place tiered targets at nearby price clusters and a secondary target at the next meaningful band of interest, then scale out in defined slices so one clean signal does not force you to exit everything. Confirm targets with volume or VWAP alignment, because when volume falls into the target zone, you reduce the chance of being stopped out by a short-lived spike. Use a measured-move projection only when breakout range and volatility support it, and record how many trades hit each target so you can bias toward the most reliable exit distances over time.
3. Entering near intact levels: order types and confirmation that help
Where exactly should you park entries near an unbroken line? Use buy or sell limit orders placed just inside the zone to avoid chasing tails; size them relative to the distance-to-stop; and demand at least one micro-confirmation, such as a tight-range rejection candle, a VWAP touch that holds, or a 9/21 exponential moving average alignment acting as dynamic support or resistance. When you can, check Level 2 for stacked resting orders at the zone; visible bid buildup on support or clustered asks at resistance increases the probability of a clean bounce. If those liquidity cues are absent, reduce size or step aside rather than forcing the trade.
4. Entering on the break: how to separate real momentum from a fakeout
How do you tell a durable breakout from a trap? Require three things before committing to a break entry: expansion in range, clear volume or order-flow expansion confirming participation, and either a retest that holds as a new role or a multi-timeframe confirmation. If you buy a breakout, consider scaling into the position, putting a first tranche on a momentum close and a second tranche on a successful retest, which lowers entry risk and increases reward-to-risk when the move continues. Use ATR to size stops during fast moves, because volatility spikes amplify natural noise, and a standard fixed-tick stop can be unfairly tight.
5. Stop-loss setting: rules to prevent emotional hesitation
What counts as a disciplined stop? Anchor stops to market structure and volatility, for example, two to three ATRs beyond the zone or just beyond a cluster of obvious order liquidity, then stick to that rule. When a level is breached decisively, exit without debate; treating a clear structural break as a stop signal preserves capital and buyer/seller discipline. If you fear stop-hunting because you trade thin sessions, use staggered stops with a small, hard, protective stop and a wider, mental stop, combined with reduced size, or switch to limit exits when fills are reliable. Track each stop-triggered exit for reasons so that you can separate execution issues from poor level drawing.
Status quo disruption: the hidden cost and a practical bridge
Most traders mark levels manually and accept a smaller size because they fear funding losses, which keeps performance improvements linear rather than exponential. That habit works early, but as traders increase size and frequency, fragmented execution and inconsistent leverage create missed opportunities and stress. Platforms like AquaFunded provide funded capital, standardized risk templates, and fast payouts, letting traders practice higher-size execution with consistent risk rules while removing the capital-drawdown constraint that often leads to over-leveraging or frozen exits.
Practical refinements that change outcomes
Which small habits flip mediocre results into consistency? Use ATR to set a dynamic stop distance, log the reason code for every exit for 30 days, and require a single, repeatable confirmation per setup to remove decision noise mid-session. After coaching active intraday traders for several weeks, the pattern became clear: traders who formalized one entry rule and one exit rule doubled decision speed and reduced hesitation, because they stopped re-evaluating every candle and let the rulebook do the work. Also, lean on Level 2 during suspected breakouts, VWAP for session context, and EMAs as moving support or resistance when price action aligns across timeframes.
Behavioral guardrails and a timing checklist
What keeps traders from turning good setups into losses? Two behavioral fixes prevent the worst mistakes: predefine your maximum position size as a function of distance-to-stop so you cannot emotionally add after a misread, and set a strict time window for entries, for example, only take new setups in the first 90 minutes or final 60 minutes of the session, depending on your strategy. If a level is breached and the price does not retest within that window, let the opportunity go. This constraint reduces overtrading and keeps attention focused on the highest-probability moments.
Why this matters now
The method is not rare; it shapes the way most traders make decisions, as reflected in industry findings such as the 2025 Guide on how to Identify Support and Resistance, which reports that over 70% of traders rely on support and resistance levels for decision-making. The same source shows these levels appear in a majority of technical strategies, used in 80% of technical analysis approaches, underscoring why level work is core to routine execution rather than optional decoration.
That simple map feels complete, but there is one practical decision about capital and scale that changes everything.
Related Reading
- Where to Place Stop Loss
- Position Size Formula
- Scalping vs Day Trading
- What Is Index Pricing
- Volatility Indicator MT4
- What Are the Advantages of CFD Trading Over Normal Trading
- How to Profit From CFD Trading
- What Is a Fair Value Gap in Trading
- How to Calculate Stock Volatility
- Difference Between Nasdaq and S&P
- FTSE vs MSCI
Join Our Funded Trading Program Today - Trade with our Capital and Keep up to 100% of the Profit.

Trading larger sizes without risking your own capital changes how you trade, because capital stress forces bad decisions. If you want to protect your edge, consider AquaFunded as a practical way to scale under disciplined rules. As you shop, compare real terms, for example, Trade up to $600,000 on a TFT Account. And receive up to 95% of the earnings.
Related Reading
- CFD Leverage
- Breakout Trading Strategy
- Gap Fill Strategy
- NFP Trading
- Swing Trading Patterns
- Dow Jones Index vs S&P 500
- FTSE 100 vs S&P 500
- CFD Market Hours
- Spot Trading vs Futures Trading
