


8 Best Practices for Traders' Technical Analysis
Discover 8 proven tips for improving traders technical analysis, helping you make smarter market decisions with confidence.
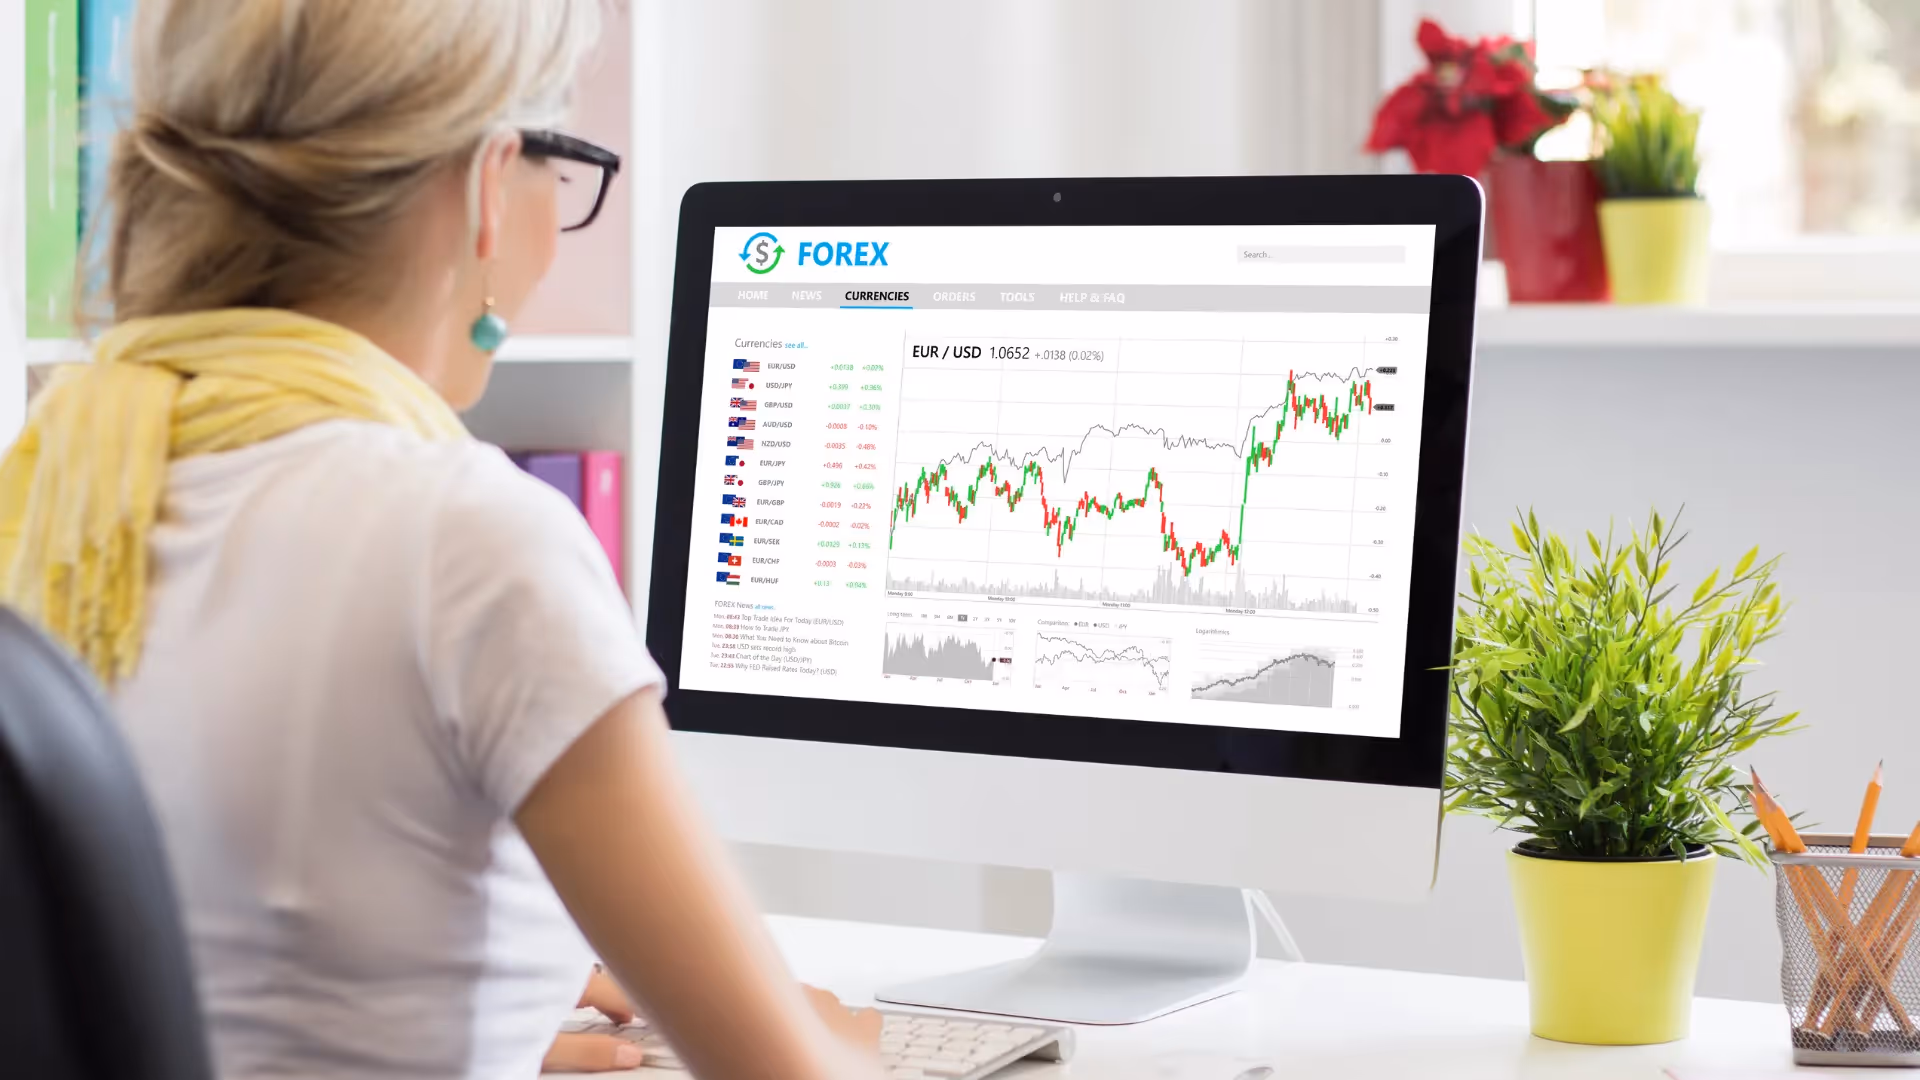
In the fast-paced world of trading, making informed decisions can feel overwhelming. Many traders face the challenge of choosing the right educational resources to decipher intricate charts and patterns. For those on a journey to improve their trading skills, understanding technical analysis is crucial to making sense of market movements. If you’ve ever wondered where to learn trading, this guide provides insights into the essential tools and techniques that traders can use to maximize their trading potential with their capital.
Aqua Funded’s funded trading program is here to help traders reach their goals. It offers a comprehensive approach to technical analysis, equipping traders with the skills they need to make informed decisions and improve their performance.
Benefits of Technical Analysis for Traders

Spotting Market Trends
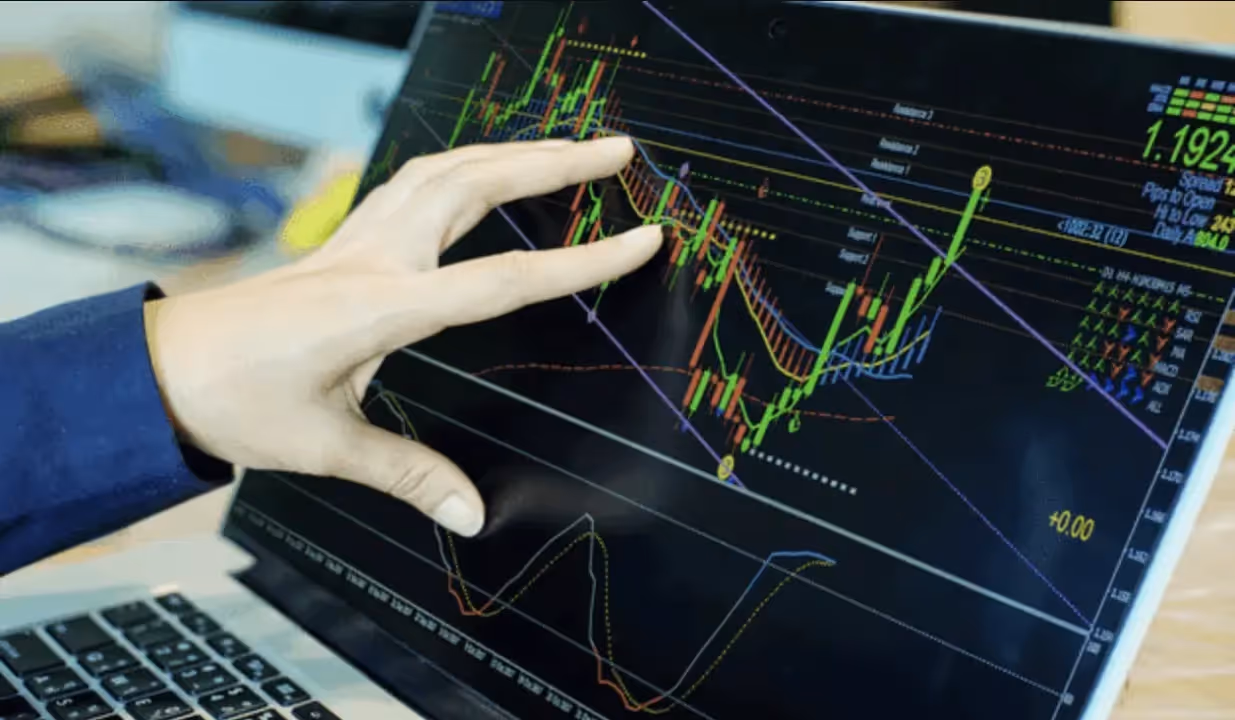
Technical analysis shines in identifying market trends using past price and volume data. Uptrends, downtrends, and reversals guide traders in aligning their strategies with market momentum. For instance, an uptrend suggests rising prices and more buyers, while a downtrend shows falling prices due to more sellers. Reversals signal shifts from one trend to another.
Trustworthy Tools
Technical analysis offers reliable indicators and oscillators like moving averages, MACD, RSI, and stochastics. These tools use historical price data to give traders buy and sell signals, aiding in accurate timing for entries and exits. Picture a MACD crossover indicating a trend reversal—a prime chance to trade. RSI and stochastic oscillators highlight overbought or oversold levels, suggesting potential reversals.
Pinpointing Entries and Exits
Traders use technical analysis to find optimal entry and exit points. By examining support and resistance, trend lines, and price reversals, traders can pinpoint ideal moments to join or leave a trend. A breakout above resistance, for example, signals an entry opportunity, while breaking a trend line suggests an exit. Reversal candlestick patterns also help determine these crucial points.
Flexible Frameworks
Technical analysis offers a versatile framework that caters to a range of trading personalities and risk profiles. Traders can select from various analytical tools, such as chart patterns, candlesticks, indicators, and oscillators. Short-term traders favor 5-minute charts with stochastic oscillators, while position traders lean toward weekly charts and moving averages. Combining different tools enhances the analysis.
Setting Targets and Managing Risk
Technical analysis aids in setting targets and managing risk by helping traders establish stop-loss levels and profit targets. By examining vital support and resistance levels, traders can anticipate price reversals and place stop losses accordingly.
Understanding Market Emotions
Technical analysis provides insight into market psychology, revealing how emotions like fear and greed affect price movement. A rapid price increase indicates greed and overbuying, signaling a potential reversal, while a sharp price drop suggests fear and panic selling, hinting at an upward reversal.
Early Reversal Signals
By closely analyzing price trends and shifts in momentum, traders can detect trend reversals early. This gives them an edge in entering new trends before most market participants catch on. A reversal candlestick pattern or MACD crossover can signal a trend change, allowing savvy traders to act swiftly.
8 Best Practices for Traders' Technical Analysis
1. Turbocharge Your Trading with Aqua Funded
Transform your trading skills into substantial profits without putting your own money on the line. AquaFunded offers you access to accounts as large as $400K, featuring the most flexible trading conditions in the industry. There are no time limits, and profit targets are easy to achieve, with up to a 100% profit split.
Join over 42,000 traders worldwide who have already collected more than $2.9 million in rewards, all backed by a 48-hour payment guarantee. Dive into trading today with instant funding options or showcase your skills through customizable challenge paths and keep up to 100% of your earnings.
2. Find Your Sweet Spot: Decide on Your Preferred Time Frame
How long do you want to hold positions? How much time can you commit to trading? Do you want to trade on 5-minute charts, hourly charts, or daily charts? Are you comfortable holding positions overnight? What other commitments do you have? Answering these questions will help you establish your preferred trading timeframe.
3. Choose the Right Chart Type for Clarity
Once you have an idea of your trading timeframe, choose the right chart type. Candlestick charts are popular due to their clear representation of price action. They provide a quick visual of how prices are moving.
4. Spot Trends with Moving Averages
Moving averages can be your ally in spotting trends. A 50-day moving average, or 50-hour for shorter-term traders, can help identify medium-term trend direction. Look for opportunities to trade in this direction.
5. Master Support and Resistance Levels
Support levels occur when buyers appear in a falling market and push the price back up. Resistance levels are where sellers enter the market at a high price and push it down. These levels can be traded on the expectation of another bounce, but they also offer profit opportunities when they break.
6. Harness the Power of Trading Tools
Numerous technical tools can reinforce your analysis. Use support and resistance levels, trend lines, price patterns like head and shoulders or double tops, Japanese candlestick analysis, or Fibonacci retracements. Understanding how to use these tools effectively is crucial.
7. Leverage Technical Indicators for Insight
Technical indicators are mathematical calculations that provide information about trend direction or market momentum. They are often used to reinforce analysis from other tools. Examples include moving averages, Relative Strength Index (RSI), Stochastics, and Moving Average Convergence Divergence (MACD).
8. Analyze Trading Volume for Clues
Heavy trading volume can confirm significant price movements, offering clues about the strength of a trend and its future direction. While volume analysis can be complex, it is valuable for identifying where significant funds are flowing.
Related Reading
- How Long Does It Take To Learn Day Trading
- How Long Does It Take To Learn Forex Trading
- How Do You Backtest A Trading Strategy
- Which Trade Is Best For Beginners
- Do You Pay Tax On Forex Trading
- How Many Day Traders Are Successful
- How Much To Start Day Trading
- How To Start Trading As A Student
- Forex Trading Psychology
- How To Do Trading Business
5 Best Technical Analysis Tools for Traders
1. Aqua Funded: Elevate Your Trading Game

AquaFunded lets traders harness their skills without risking personal capital. With access to accounts up to $400,000, the platform provides flexible trading conditions, including no time limits and achievable profit targets. Traders can enjoy a profit split of up to 100% and a swift 48-hour payment guarantee. Whether you choose instant funding or prove your skills through customizable challenges, AquaFunded has you covered.
2. ProRealTime: Your Comprehensive Trading Ally

Developed by IT-Finance, ProRealTime has been a trusted technical analysis tool since 2001. Available for free on multiple devices, it integrates seamlessly with brokers like Interactive Brokers and Saxo. This platform offers an array of features, including charts, indicators, and automated trading, all supported by professional-grade market data.
Pros
- Highly customizable layouts
- Unlimited technical indicators
- Real-time, professional-grade data
Cons
- Steeper learning curve
- Lacks built-in fundamental data
3. TrendSpider: Automate Your Analysis
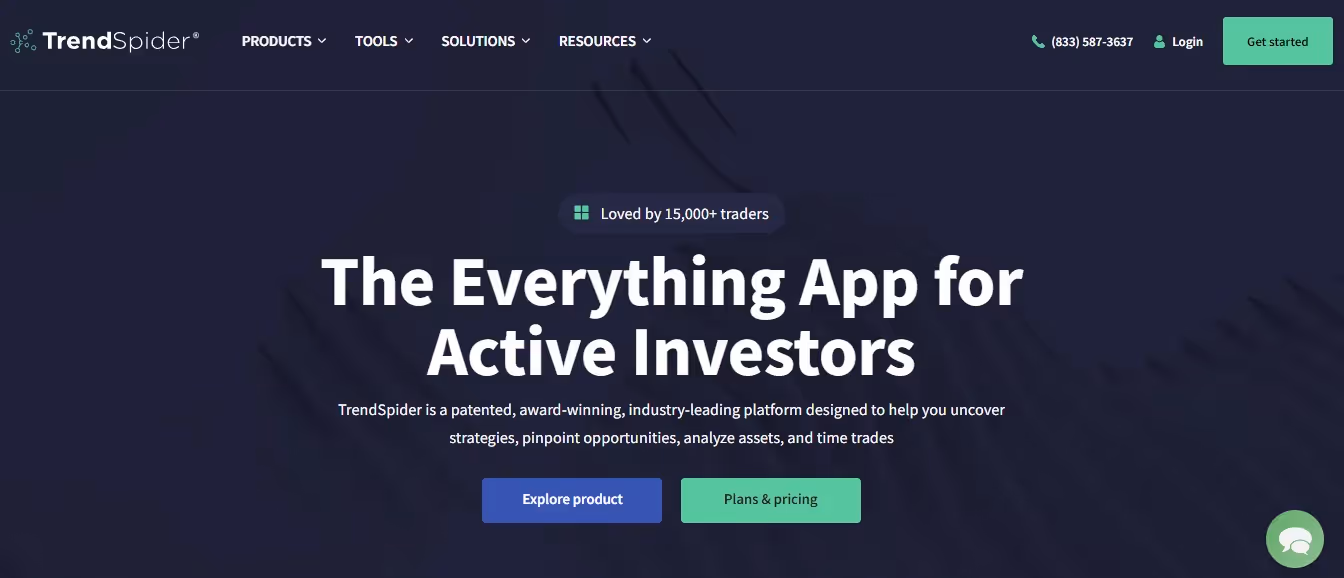
TrendSpider uses AI-powered tools to automate technical analysis, eliminating manual chart drawing. Founded in 2016, the platform caters to traders who want to work smarter. Standout features include automated trendlines and an intuitive strategy tester. While it doesn’t support direct broker execution, it offers deep customization and real-time data.
Pros
- Highly customizable
- Easy to create complex tests and charts
- Modern, intuitive interface
Cons
- Less realistic market conditions in tests
- No free plan available
4. TradingView: Connect and Analyze Globally

TradingView, launched in 2011, combines technical analysis and social interaction. With over 90 million users, it offers a plethora of built-in indicators, intelligent drawing tools, and chart templates. Users can set alerts and trade from charts. Advanced features like Bar Replay and backtesting are included.
Pros
- Large social trading community
- Extensive drawing tools and indicators
- Mobile app with many features
Cons
- Ads in the free version
- Some features require a subscription
5. MetaTrader 5: Craft and Automate Your Trades

Available since 2010, MetaTrader 5 is a free trading platform focusing on forex, stocks, and futures. Despite its dated interface, it offers essential tools for technical analysis and supports custom indicators through its MQL programming language. Users can create automated trading systems and subscribe to signal services.
Pros
- Powerful scripting for custom tools
- Extensive plugin ecosystem
- Free to use
Cons
- Outdated interface
- Limited native indicators
How to Choose the Best Technical Indicator for Traders

Spot the Market’s Behavior First
First things first: understand whether you’re dealing with a trending or sideways market. If prices are moving up or down consistently, trend-following tools like moving averages, MACD, and ADX can help you ride the wave. In sideways markets, where prices bounce between support and resistance, oscillators like the RSI and stochastic are your best bet. Recognizing the market environment is essential to choosing the right technical analysis tools.
Use Your Eyes, Not Just Indicators
Sometimes, the simplest tools are the most powerful. Grab a pen and start marking up your charts with trendlines and price channels. You can spot the overall direction the market is heading. Fibonacci retracement levels can help you identify support and resistance zones where prices might react. By manually marking key levels and patterns, you can develop a deeper understanding of market structure beyond what indicators alone can reveal.
Match Your Tools to Your Trading Style
Once you’ve picked your indicators, adjust them to fit your trading style and timeframe. Day traders in fast markets will want to set their inputs to lower values to capture real-time activity, while longer-term traders will go for higher values to get a macro view. On intraday charts, traders may look at 5-, 8-, or 13-bar moving averages, while longer-term traders may use 20-, 50-, or even 200-bar moving averages. Indicators calculate bar by bar so that you can fine-tune your analysis for your type of trading.
Combine Indicators for Best Results
Although you don’t want to overcomplicate your analysis, most indicators work best when combined with others to confirm trends, turning points, support resistance levels, and your trade setups. Finding the right combination of indicators for your trading style can be challenging and rewarding at the same time.
Find Your Perfect Match
Every market has a unique personality. Some are more volatile, while others are quiet and steady. Determining which market fits your personality will help you decide which indicators to use. There are some indicators designed primarily for the futures markets, including the commodity channel index (CCI), floor trader pivots, VWAP, Ichimoku Cloud, and Commitment of Traders (COT). Used alone or in combination, these are the same indicators professional traders use every day.
Ready to turn your trading skills into substantial profits without risking your capital? AquaFunded offers a funded trading program with accounts up to $400K, no time limits, easy-to-achieve profit targets, and up to 100% profit split. Join over 42,000 traders worldwide who've already collected more than $2.9 million in rewards.
Related Reading
- How To Learn Trading Online
- Is Day Trading Worth It
- Is Day Trading Hard To Learn
- Trading Strategy For Beginners
- Position Trading Strategy
- Profitable Gold Trading Strategy
- Option Trading Technical Analysis
- Forex Trading Strategies For Beginners
- Profitable Gold Trading Strategy
- Trading Strategy For Beginners
- Position Trading Strategy
Join Our Funded Trading Program Today - Trade with our Capital and Keep up to 100% of the Profit.
Think about what it would be like to turn your trading skills into real profits without putting your own money on the line. AquaFunded gives you just that opportunity. Access accounts up to $400K and enjoy the most flexible trading conditions in the industry. We're talking no time limits, easy-to-hit profit targets, and up to 100% profit split.
Who wouldn’t want that? More than 42,000 traders worldwide have already cashed in on over $2.9 million in rewards. With AquaFunded's 48-hour payment guarantee, you don’t have to wait long for your success. Jump into trading today with instant funding options, or prove yourself with customizable challenge paths. Either way, you get to keep up to 100% of what you earn.
Related Reading
- Forex Risk Management Tools
- Algorithmic Trading Risk Management
- Best Forex Trading App For Beginners
- What Is Risk Management In Trading
- Trading Risk Management Tools
- Best Day Trading Platform For Beginners
- Best Indicators For Swing Trading
- Day Trading Risk Management
- Best Platform For Day Trading Crypto
- Best Beginner Trading App
