


What Is Index Pricing
You check the index feed before the bell and see a number move faster than the stocks you follow, and you wonder what really sets that index price. In Day Trading, Indices that number drives signals, stop placement, and settlement outcomes, so knowing how index price comes from component stock prices, weighting rules, futures fair value, and intraday ticks can save you money.
This guide explains closing prices, the distinction between spot and futures, bid-ask and spread behavior, and volatility gaps in plain terms, so you can trade with more confidence and work toward professional trading with a funded account.
If earning a funded account is your goal, AquaFunded's Funded Trading Program provides a clear path with capital, rules, and honest feedback, enabling you to transition from learning about index pricing to live, funded trading.
Summary
- Revisions to base periods can significantly alter how traders interpret history, as demonstrated by the revision of the GDP price index for Q1 2023 to a 2.9% increase, highlighting that published index series are evolving inputs rather than immutable facts.
- Component weighting firmly steers index moves, with some methodologies covering roughly 85% of free-float-adjusted market capitalization, and sector shocks, like a 3.5% monthly rise in energy, can reweight an index and force rapid portfolio adjustments.
- Different index types have varying lead times for action. For example, a 0.8% CPI increase in February tightened short-term positioning, creating immediate scalping and straddle opportunities across equities and bonds.
- Operationally, manual index assembly becomes a hidden drag, as teams that automate reporting typically reduce reconciliation cycles from days to hours, thereby reducing errors and decision latency that eat into margins.
- Convert index readings into rules, not reflexes, by testing controlled gaps such as a 5 percent or 10 percent deviation from the index to measure conversion and margin impact before scaling repricing moves.
- Contract design matters because customer rates are often based on an index, margin, and locational adjustments, and procurement reviews in 2023 and 2024 found that opaque margin language, rather than the headline add-on, caused the most disputes.
- AquaFunded's Funded Trading Program addresses this by providing capital, clear rules, and honest-time feedback, allowing traders to practice applying index-pricing signals in funded live trading.
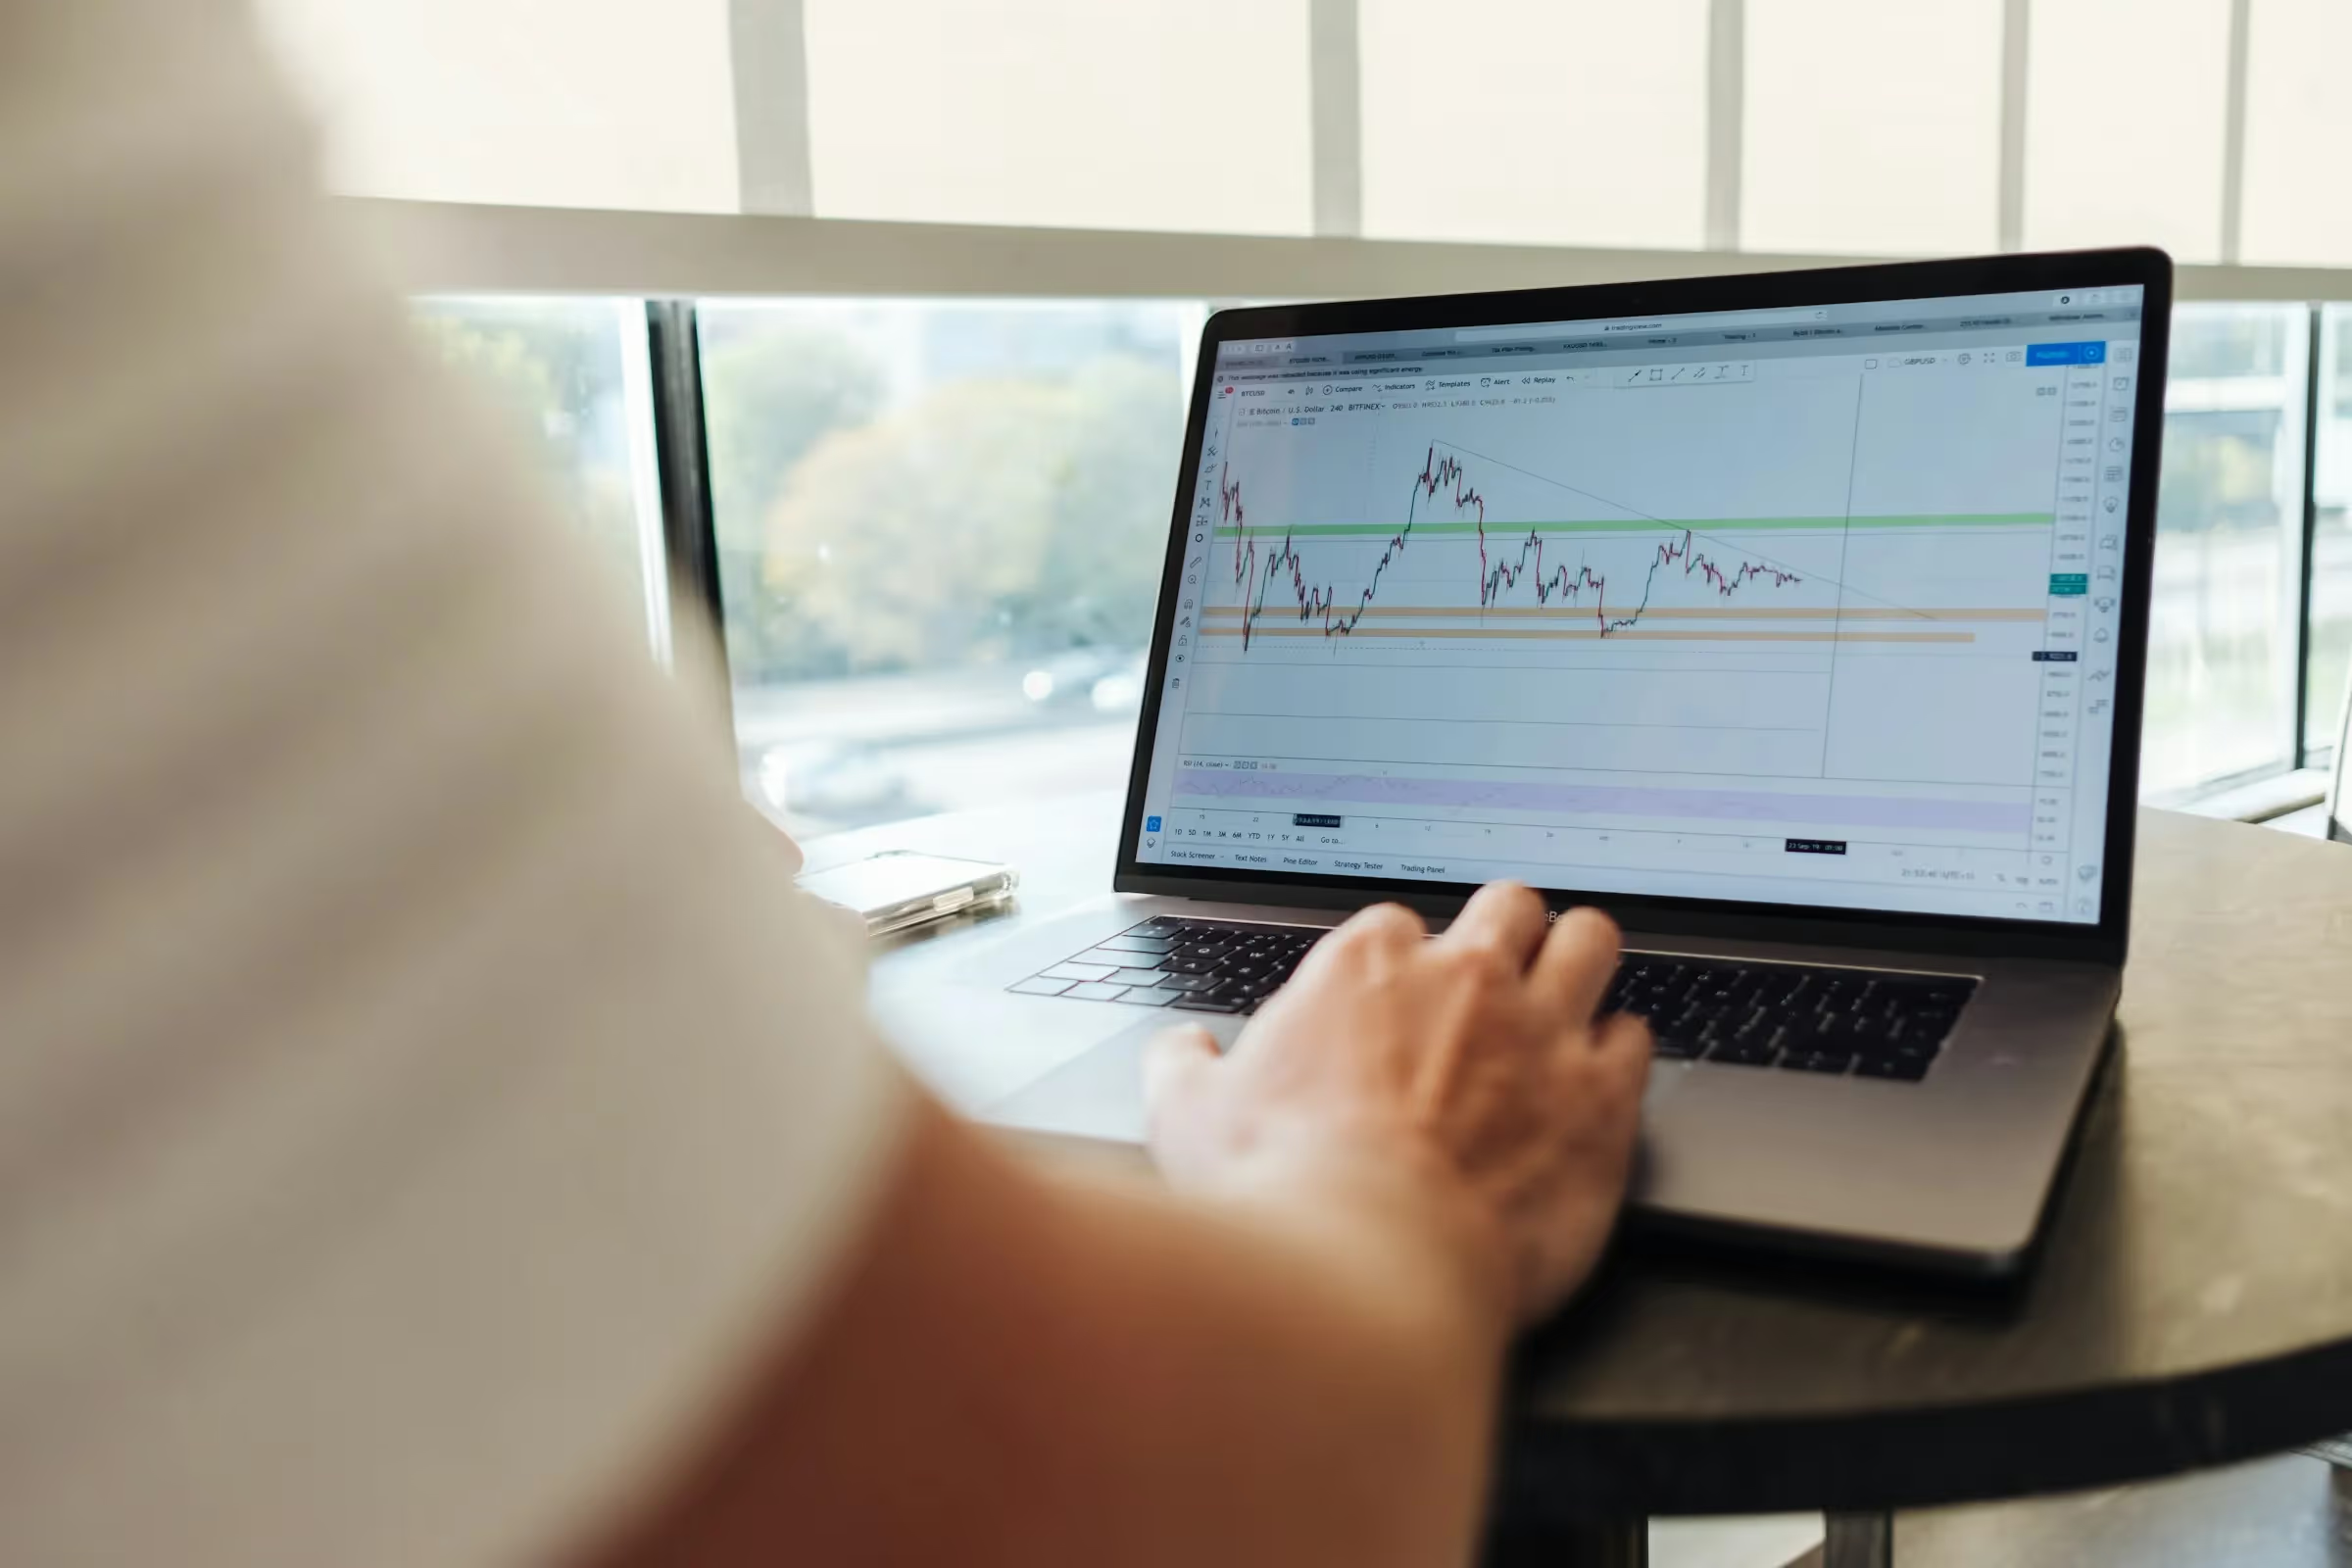
What Is Index Pricing
.avif)
Index pricing is a method for quantifying the average price of a defined group of goods or financial instruments over time, providing traders with a single reference point to track, compare, and trade market-wide shifts. You can think of it as the engineered score that turns many individual prices into a usable signal for decisions about entries, risk sizing, and hedging.
How exactly is an index built?
1. What does the index represent?
An index price condenses many individual prices into a single reported value that reflects the change for a broader market segment. Rather than tracking one stock or one commodity, it measures collective movement, allowing you to determine whether broad buying or selling pressure exists, how quickly it changes, and where momentum is concentrated.
2. What components are included?
Every index is defined by a specific basket of constituents chosen to represent the market it intends to reflect. Those constituents can be stocks, futures contracts, commodities, or services. The selection rules matter: some indexes use the most prominent names based on market presence, others use a curated sector mix, and some follow fixed rules, ensuring the basket is predictable. The result is that the index’s behavior depends as much on what’s included as on how those pieces move.
3. How are weights applied?
Components do not count equally. Indexes assign different weights so that larger, more economically meaningful items influence the composite value more strongly. Weighting schemes vary, from market value weighting to equal weights or factor-based weighting. The choice changes both short-term volatility and long-term drift, so traders match a weighting style to the strategy they want to execute.
4. Why does the base period matter?
Index prices are reported relative to a base period, a reference point that sets the index’s scale and the baseline for percent changes. Base-period selection and any later rebasing affect historical comparisons and backtests. That matters for day traders calibrating stop levels and for system builders who rely on consistent historical behavior, because revisions to official series can shift interpretations after the fact, as happened when the GDP price index for the first quarter of 2023 was revised to a 2.9% increase. This revision, released by the U.S. Bureau of Economic Analysis in 2023, highlights why traders should treat published index histories as evolving inputs, rather than immutable facts.
5. How does a shock to one component change the whole index?
When a heavily weighted item surges or collapses, it pulls the whole index with it. For example, if building materials account for a significant portion of a housing-related price index, a sudden spike in lumber costs will drive that index sharply higher, even if other components remain steady. That linkage is why understanding both individual component drivers and their weights is crucial for forecasting short-term spikes and anticipating mean-reversion opportunities.
What do these mechanics mean in practice for a trader?
If you want to trade an index, you must treat its construction as part of your edge. Weighting choices, rebalancing schedules, and the base reference all change realized returns and risk. For context on macro pressure that traders watch when sizing indices, the GDP price index increased by 3.5% in the second quarter of 2023. The number, from the U.S. Bureau of Economic Analysis in 2023, provides a backdrop for determining whether index movements reflect localized supply shocks or broad inflation.
A typical pattern I observe among retail traders and active strategists is that they are distracted by headline financial stories instead of delving into index mechanics. That tendency makes them misread drivers and chase the wrong signals. It’s exhausting when noise becomes the decision driver; disciplined traders treat the index definition as primary and headlines as secondary color.
Most traders piece indices together in spreadsheets because it is familiar and cheap. That works while the basket is small, but as instruments, weights, and rebalance rules multiply, manual upkeep creates errors and lag. Platforms like AquaFunded automate index construction, live weighting, and rebalancing, significantly reducing setup and maintenance time while preserving auditability and minimizing mispricing risk.
Think of an index like a calibrated scale where each component is a weight; a single heavy plate moved even slightly shifts the balance, and the job is to know which plates matter before you trade.
That simple map of components, weights, base periods, and shock transmission is sound, but the deeper tradecraft comes next — and it is not what most people expect.
Types of Index Price
There are four primary types of index prices that traders use as distinct signals: the Consumer Price Index, the Producer Price Index, the Wholesale Price Index, and the Commodity Price Index. Each type sits at a different point in the production and distribution chain, so they behave differently, create various kinds of volatility, and deserve tailored trading rules.
1. Consumer Price Index (CPI)
What it tracks and why traders care. The CPI measures changes in the prices households actually pay for a basket of goods and services, so it is the most direct market probe of purchasing power and inflation expectations. Futures, short-term options, and macro pairs trade hard around CPI prints because the metric feeds monetary policy bets and real-rate expectations.
For tactical traders, CPI releases often lead to a tightening or widening of implied volatility in equity and bond markets within hours, creating scalping and straddle opportunities around the headlines. A recent reading, captured by the Consumer Price Index (CPI), increased by 0.8% in February, as published by the Service Public in 2025, indicates how immediate consumer price pressure affected short-term positioning that month.
2. Producer Price Index (PPI)
What it measures and how to use it. PPI records the average change in prices received by domestic producers for goods and intermediate inputs, providing an early signal of margin pressure and supply-chain stress before those costs are passed on to consumers. For equity traders, PPI surprises can reprice sector leadership, especially in industrials and materials.
Meanwhile, fixed-income traders use them to detect hidden inflation trends that central banks might eventually react to. Over multiple quarters, consistent divergence between PPI and CPI can flag margin compression or widening profit pools, which you can exploit with sector rotation or pair trades that express relative winners and losers.
3. Wholesale Price Index (WPI)
Practical shape and typical market behavior. WPI tracks prices at the wholesale level, often focused on bulk goods and intermediate inputs used by manufacturers, agriculture, and distribution networks. Think of WPI as the factory-floor temperature gauge; it tells you whether upstream prices are building heat that will later radiate through the system.
Traders watching supply-driven cycles use WPI to time commodity spreads and to forecast inventory markdowns or cost pass-throughs to retailers, because strong wholesale inflation usually precedes consumer impacts by weeks to months.
Most traders familiarly manage these signals, pulling reports and updating spreadsheets in the morning session. That works at first, but as you add more indices, manual processes fragment, release times clash, and you miss intraday correlations that matter for position sizing.
Those hidden costs add up, eroding edges through slower reaction times and patchy audit trails. Platforms like Funded Trading Program centralize feeds, synchronize release timestamps, and deliver calibrated risk limits, allowing teams to maintain tight trade execution without rebuilding integration every quarter.
4. Commodity Price Index
What it covers and the trade mechanics. Commodity indices aggregate prices across various raw materials, and they are often divided into sub-indices for energy, metals, and agriculture, each with distinct seasonality and inventory dynamics. Pricing here depends on spot levels, the shape of futures curves, and storage or transportation constraints, so traders must read both cash and forward curves to estimate roll yield and convenience yield.
Short-term shocks in the energy component are especially disruptive in broader commodity baskets, as illustrated by the 3.5% rise in energy prices over the month, as reported in a 2025 Service Public release. This illustrates how a single sector's move can alter index behavior and prompt rapid portfolio rebalancing.
A quick practical note on instruments and behavior. CPI prints move macro markets; PPI and WPI move sector and supply-chain plays; commodity indices move futures curves and cross-commodity spreads. For day traders, this means selecting an index type and then choosing instruments that are consistent with that index, such as short-dated futures for CPI-driven volatility or calendar spreads for commodity roll dynamics.
If you want to see how these signals combine in live execution, consider trading them like weather reports. CPI is the barometer, PPI the radar for approaching fronts, WPI the ground sensors in a factory, and commodity indices the regional storm map, each giving different lead times and decision horizons.
Turn your trading skills into substantial profits without risking your own capital. AquaFunded gives you access to accounts up to $400K with the most flexible trading conditions in the industry - no time limits, easy-to-achieve profit targets, and up to 100% profit split; learn more about our funded trading program and choose instant funding or challenge paths that suit your style.
That next piece uncovers the exact steps traders use to convert these readings into actionable, repeatable pricing inputs.
Related Reading
- What Is Considered a High VIX
- What Is a Trading Session
- What Is Support and Resistance in Trading
- What Is a Stock Market Index
- How to Trade S&P 500 Futures
- How Is the Dow Jones Calculated
- Trading the DAX
- CFD Indices
- Asset Class Correlation
How to Calculate Index Pricing

Index pricing for energy is calculated by selecting an appropriate market index, converting the index reading into a customer-facing rate with a negotiated margin and any locational or delivery adjustments, and then allowing that rate to fluctuate in near real-time according to the index settlement rules. The practical steps are selection, arithmetic, and governance, each with choices that alter risk and cash flow for both the buyer and the supplier.
1. Which market index should you tie your contract to?
Select an index that matches the commodity and region for which you pay, and assess the transparency and liquidity of its underlying contracts. Regional electricity hubs, NYMEX natural gas, and specific forwards or spot-price publications behave very differently when congestion, weather, or pipeline flows shift.
When we onboarded commercial buyers across 2024, the pattern became clear: teams that started by matching location and settlement timing avoided the most surprising basis moves, while others felt blindsided by local congestion charges that the headline index never reflected. That mismatch commonly produced what appeared to be mispricing on the monthly bill, not because the math was incorrect, but because the reference wasn’t fit for purpose.
Read the index rulebook before you sign, because construction matters, not just the name. Many indices publish their weighting and eligibility rules; for example, MSCI’s 2025 methodology explains construction choices and disclosure practices, and explicitly states the industry approach summarized as "The index is calculated using a free float-adjusted market capitalization weighted methodology."
2. How do suppliers turn that index into a consumer price?
The most straightforward arithmetic is index price plus a fixed margin, but commercial contracts layer on basis adjustments, loss factors, delivery fees, and sometimes time-weighted averaging. Practically, you will see formulas that look like: Customer Rate = Published Index + Supplier Margin + Locational Basis + Transmission/Loss Adjustments ± Contractual Fees.
Margin can be a fixed cents-per-unit charge, a percentage, or a sliding schedule tied to volume or tenure. Each choice shifts who carries short-term versus structural risk. After pricing dozens of offers for 2023 and 2024 procurement clients, we found that opaque margin language caused the most disputes, not the headline add-on, because buyers did not understand how daily or monthly averaging would change realized cost. That confusion is exhausting for procurement teams and often leads to incorrect hedging decisions.
Treat the formula as a small program, not a sentence. Specify settlement windows, averaging periods, and whether the margin is applied before or after any index premium. Ambiguity here is where cash flow surprises hide.
3. How do real-time adjustments and governance work?
Index pricing is not static; it updates as the publishing market moves. Contracts must define settlement cadence, notification mechanics, and the allowable range for intraperiod corrections. You need clear rules for daily publication errors, revisions, and dispute resolution.
Suppliers typically hedge to stabilize their margins, but hedging narrows the benefits when prices fall and who pays when prices spike. For customers who want protection, contract levers include caps, collars, or optional fixed-rate windows, and each lever has a cost and execution tradeoff. In practice, an index that represents most market activity reduces basis risk, which is why construction coverage matters; MSCI notes in its methodology that "The index includes approximately 85% of the free float-adjusted market capitalization in each country." That kind of representativeness helps explain why some indices track the accurate market and others miss local stress points.
Operationally, set up reconciliation rules and billing lags, and decide who bears revisions from index publishers. Minor wording differences, such as whether an average is volume-weighted or time-weighted, can materially change realized prices for high-usage accounts.
Most teams price manually because spreadsheets are familiar and the initial volume is low, which makes sense early on. However, this habit becomes fragmented when you add more rate indices, nodal points, or bespoke adjustments, as reconciliation and auditability become increasingly painful and prone to error. The hidden cost is not a single bad month; it is the steady erosion of trust, time wasted fixing disputes, and hedging that mismatches exposure. Platforms like AquaFunded centralize index feeds, automate formula application, and provide audit trails for each published settlement, reducing reconciliation cycles from days to hours while keeping full versioned records that both buyers and suppliers can trust.
Think of index selection and formula design like choosing a hull and ballast for a ship; the hull determines where you can sail, and the ballast determines how stable you are when waves hit.
That choice feels decisive now, but what you do next will determine whether you capture upside, control downside, or get rolled by volatility.
How to Use Index Pricing for Your Advantage
You use index pricing to make more innovative, repeatable moves: translate the index into action rules, test small changes, and let automation do the heavy lifting, so you can protect your margin while competing on price. Do that and the index becomes a decision engine, not a spreadsheet obsession.
1. Interpretive signals you should extract
Read the index for four key signals: where your price sits in relation to the market, the index's trend direction, the volatility bands, and persistent outliers. Treat each as a trading input: position your price when the trend is favorable, tighten or widen spreads when volatility spikes, and flag outliers for investigation rather than reflexive repricing.
2. Organize for decisions, not record keeping
Build a single master table that normalizes SKUs, competitor IDs, timestamps, and a calculated price index column for each group. Include computed fields for percent-from-index, rolling volatility, and last-change timestamp so you can filter by risk, not by raw rows. Keep one canonical sheet for rules and another for experiments, so reporting stays auditable and your tests do not contaminate live regulations.
3. Why does the manual daily index work collapse
This problem arises across small storefronts and scaled marketplaces: as SKU counts grow and price churn increases, manual updates become error-prone and slow, and decision latency erodes margins. It is exhausting when teams spend their mornings reconciling feeds instead of refining their strategy, and that fatigue leads to brittle decisions and missed opportunities.
4. Automate collection and normalization
Automated competitor monitoring scrapes or connects via API, timestamps every quote, deduplicates listings, and normalizes currencies and units. That moves you from guesswork to verified inputs you can trust for automated rules or structured tests, eliminating most manual reconciliation.
5. Data quality and governance
Design validation rules that reject obviously incorrect values, flag sudden outliers, and compare publisher revisions against cached originals. Maintain a small audit log that records why a quote was dropped or adjusted, so you can explain outcomes to finance or procurement without having to dig through emails.
6. Customize indexes for practical edge
Tools such as Price2Spy let you slice indexes by brand, seller type, or fulfillment channel and export tailored reports. Utilize these custom views to safeguard high-margin SKUs, highlight low-margin loss leaders, and establish index benchmarks that align directly with your P&L drivers.
7. Use the index to control your market stance
Do not race to the absolute lowest price. Instead, convert index readings into guardrails: set a minimum acceptable margin relative to the index, a maximum frequency for repricing, and a test increment, such as moving the price by a small percentage and observing conversion and margin. Over time, you learn whether a 5 percent or 10 percent gap from the index buys a sustainable share without destroying profit.
8. Turn index gaps into supplier leverage
When competitor indexes consistently sit beneath yours, that is leverage, not just bad luck. Use the evidence to renegotiate terms, request volume discounts, or ask for shorter lead times. Presenting a time series of indexed prices, with precise dates and SKU groups, changes procurement talks from anecdote to arithmetic.
9. Index at category and cluster level
Aggregate SKUs into logical clusters, then build a category index for each cluster. That tells you where to concentrate the promotional budget and where to accept structural disadvantages. If sports equipment shows a durable index advantage but consumer electronics does not, either shift investment or run a focused turnaround experiment.
10. Backtests and controlled experiments
Run rolling-window backtests to see how index-relative pricing would have affected margin and conversion over past seasons, and then field controlled experiments with narrow cohorts. Use statistical thresholds for lift before you scale a change; a small sample will tell you whether the index signal was causative or spurious.
11. A pragmatic repricing playbook
Turn learnings into rules: who approves exceptions, how long a promotion runs, minimum margin floors, and the escalation path for significant index moves. Implement a kill switch to prevent runaway repricing and a throttler to limit the frequency of price changes for the same SKU within a 24-hour period.
12. Measure impact with tight KPIs
Track gross margin per SKU cluster, conversion lift per price step, inventory turnover, and share-of-search. Reconcile results back to the index inputs so you know which signals are predictive and which are noise. This closes the loop and reduces guesswork over time.
Most teams manage this with spreadsheets because they are familiar, but as complexity grows, those sheets become fragmented and waste time. As stakeholders multiply and repricing needs accelerate, teams find that centralized feeds, automated rule engines, and time-series reports cut reconciliation from days to hours; platforms like Funded Trading Program provide those capabilities, offering real-time competitor feeds, rule-based repricing, historical index charts, and customizable alerts so teams keep decisions tight without rebuilding integrations.
Think of the index like a tide chart for pricing; it tells you when to set sail and when to hold the anchor.
But the frustrating part? This still leaves one big lever unexplored that changes how you scale everything.
Related Reading
- Where to Place Stop Loss
- Position Size Formula
- Scalping vs Day Trading
- Volatility Indicator MT4
- What Are the Advantages of CFD Trading Over Normal Trading
- How to Profit From CFD Trading
- What Is a Fair Value Gap in Trading
- How to Calculate Stock Volatility
- Difference Between Nasdaq and S&P
- FTSE vs MSCI
Join Our Funded Trading Program Today - Trade with our Capital and Keep up to 100% of the Profit.
We know it is exhausting when unanswered support tickets and slow payouts sap your edge, so if you want to trade without risking your capital consider AquaFunded for instant funding or a challenge path that puts rewards where they belong, with Keep up to 100% of the Profit Join Our Funded Trading Program Today, and an introductory 20% OFF for New Customers Join Our Funded Trading Program Today. Take a small step today, prove your edge on a customizable route, and see whether faster payouts and more explicit rules let you focus on performance instead of paperwork.
Related Reading
- CFD Leverage
- Breakout Trading Strategy
- Gap Fill Strategy
- NFP Trading
- Swing Trading Patterns
- Dow Jones Index vs S&P 500
- FTSE 100 vs S&P 500
- CFD Market Hours
- Spot Trading vs Futures Trading
