


How to do Investment Performance Analysis in 10 Steps
Investment Performance Analysis: learn 10 steps to measure returns, manage risks, and test strategies with AquaFunded’s funded program.

A solid plan on paper may face unforeseen challenges when real capital is at stake. Traders often ask, 'What is a funded account?' and rely on investment performance analysis to discern which trades deliver returns and which introduce undue risk. Metrics such as the Sharpe ratio, alpha, and beta help illuminate performance drivers and potential vulnerabilities within a strategy.
Understanding these indicators enables traders to fine-tune their approach and control portfolio volatility. Applying clear performance checks can transform theoretical strategies into actionable plans. AquaFunded’s funded trading program pairs transparent performance rules with real capital, providing tools to execute trades with confidence and precision.
Summary
- Investment performance analysis turns opinion into measurable choices, with over 70% of investors calling it a crucial, disciplined measurement that has been shown to improve portfolio returns by up to 15%.
- Risk often hides in concentration and correlation shifts, and a diversified portfolio can reduce risk by up to 30%. Routine checks on exposures and drawdown patterns are essential to prevent sudden losses.
- Market volatility erodes model assumptions quickly, and over 60% of investment analysts report difficulty predicting trends, underscoring the need for monthly attribution and regime testing.
- Adopting AI changes workflows rather than eliminating them, with analysts spending approximately 30% more time on data analysis than five years ago. Prioritize data cleaning and model supervision before automating outputs.
- Tool adoption is widespread: 85% of investors use at least one analysis tool, and over 70% report improved investment performance after adoption. Yet many teams still rely on spreadsheets that fragment as accounts and asset classes multiply.
- Sound measurement requires matching return formulas and risk metrics to the analysis objective, using benchmarks like the S&P 500 historical average of about 9.8% annually to set realistic expectations and using attribution to separate alpha from beta.
- This is where AquaFunded's funded trading program fits in, pairing clear performance rules with real capital and simple reporting, including fully funded accounts up to $400K, so traders can measure true returns without risking their own capital.
Importance of Investment Performance Analysis

Investment performance analysis is important because it provides a clear way to protect your money and improve yourresults. It changes opinions into measurable choices you can act on. When you focus on what matters, you can see where to reduce exposure, where to invest more, and how to keep your portfolio aligned with your goals.
1. Risk Mitigation
Risk can sneak up on you and then suddenly become a big issue. By breaking down exposures, drawdown patterns, and shifts in correlation, you can find problems before they get worse and take specific steps to limit losses.
This problem often affects retail investors and small advisory practices; hidden concentrations in a sector or a single factor can lead to large losses that a simple monthly check could have flagged. So, risk controls should be seen as active defenses, not just paperwork, as explained in the risk controls guidelines.
2. Smarter Decisions about Capital
Good analysis supports better decision-making rather than just guessing. Breaking down returns into sources, fees, and timing effects helps you clearly compare trade-offs. This clarity helps investment choices fit with your time frames and risk levels. A 2025 study by Confluence Technologies found that over 70% of investors consider performance analysis very important for decision-making, underscoring the need for careful measurement in allocation discussions.
Most teams currently conduct performance reviews with spreadsheets and ad hoc reports, which are familiar and easy to use. While this method might be fine at first, as the number of accounts and strategies increases, manual processes can become messy and take longer. As a result, decisions might shift from daily control to quarterly surprises.
Platforms like AquaFunded bring all reporting together, automate attribution, and keep a record of everything. This helps teams reduce manual work, respond to signals faster, and maintain oversight. If you're interested in enhancing your strategy, consider our funded trading program for tailored support.
3. Ongoing Performance
Tracking is not a ritual; it is feedback. Regularly checking and comparing against benchmarks helps show whether a strategy is still working orhas turned into a game of chance.
When you do these checks every month, small trends become clear, allowing you to adjust or take profits before losses get worse. This way, you keep your portfolio aligned with your goals.
4. Spotting Opportunities Others Miss
Spotting opportunities that others miss sharpens your radar for asymmetric bets. By watching for factor tilts, sector momentum, and valuation gaps, you can find pockets of growth or mispricing that regular portfolio monitoring often overlooks.
Many investors miss these insights because they usually focus on account-level returns. Focusing on factors and sectors can reveal tactical windows that offer outsized contributions.
5. Planning for Outcomes and Resilience
Planning for outcomes and resilience is essential for good performance analysis. A strong financial plan can withstand stress rather than relying solely on past returns. By predicting scenarios, stress-testing exposures, and designing diversification strategies that work under pressure, you can turn unpredictable situations into definite actions.
This keeps your long-term goals achievable, even when markets are challenging. Confluence Technologies' 2025 analysis shows that investment performance analysis can improve portfolio returns by up to 15%, underscoring the potential increase when measurement drives portfolio changes.
Think of this process like maintaining a classic car: if ignored, small problems can build up into breakdowns; if tuned regularly, the engine runs cleaner, longer, and faster.
While simple inspections seem comforting, the reasons for performance analysis failures when the stakes are high are more complex.
It's important to look at these complexities next.
Related Reading
- How to Grow a Small Trading Account
- What is Trading Commodities
- Long Term Trading Strategy
- Capital Growth Strategy
- What is a Cash Account in Trading
- What is Compound Trading
- How Much Money Do You Need to Start Trading Stocks
- Scale Trading
- Small Account Trading
- How to Evaluate Investment Opportunities
- Blown Trading Account
- What is PNL in Trading
- Do Prop Firms Use Real Money
- Prop Firm Account Management
- Borrowing on Margin
- Trading Leverage
Challenges of Investment Performance Analysis

Performance analysis is tough because the information you rely on keeps changing, and the job needs you to turn confusing, quick-moving signals into clear, quick decisions.
Each challenge below demonstrates how a different pressure point affects measurement, lengthens workflows, or conceals risk.
To tackle these challenges more effectively, consider how our funded trading program can provide the support you need.
1. Navigating market volatility.
When markets change rapidly, short-term noise can overwhelm the signals we use to understand and compare performance. Predictions that once expected steady growth or stable interest rates can suddenly be wrong, and estimates of how things are related can change in weeks, not quarters. According to Financial Regulation Courses, "Over 60% of investment analysts report difficulty in accurately predicting market trends due to increased volatility". This is a common problem in real life, not just a theoretical idea.
The real effect is easy to see: models made for calm markets often focus on putting money into recent winners. By the time we notice a major shift is happening, the losses are already serious. We have seen similar trends among big investors and mid-size advisory teams, where their scenario libraries seem sufficient until a sudden geopolitical event makes many of their assumptions wrongat once. For those looking to mitigate risks, our funded trading program can provide strategic support in volatile conditions.
2. Leveraging artificial intelligence and automation
Using artificial intelligence and automation can speed up analysis, but it also changes where people focus their work. Analysts now spend a lot more time cleaning, checking, and overseeing models than they did five years ago. This change happens because bad inputs can lead to confident but wrong outputs. According to a source, Financial Regulation Courses, "Investment analysts spend approximately 30% more time on data analysis compared to five years ago" (2025).
Because of this, automation often moves work around rather than eliminating it completely. A common problem occurs when teams treat model outputs as final answers rather than ideas to test. This mistake can cause them to overlook small data changes, labeling mistakes, or fitting too much to temporary trends. In the end, it feels like replacing one backlog with another, along with the stress of seeing overnight alerts pile up without a clear plan to handle them.
3. Changing regulatory environment
Changing rules across different places creates varying reporting requirements and makes it harder to manage paperwork, especially for strategies that span multiple countries. Adding new requirements that introduce additional fields results in several overlapping reports. Each report may have slightly different meanings for performance attribution. As a result, audit trails often fail when someone asks for a combined calculation.
The real challenge comes not from the rules themselves but from how they force quick fixes into established workflows. This makes manual reconciliation and decision-making more difficult. In this situation, intact governance is crucial; without automated tracking and clear definitions, even a single question from a regulator can turn a simple review into a lengthy investigation lasting several days.
How do solutions like AquaFunded reduce friction?
Platforms like AquaFunded serve as a natural bridge to making reporting easier. Most teams use spreadsheets because they are simple and everyone knows how to use them, which can work well at the start. However, as the number of accounts, asset types, and rules grows, these makeshift sheets can lead to fragmentation. This can lead to mistakes, account-balancing issues, and missed disclosures.
Solutions like AquaFunded gather data connectors in one place, make sure definitions are used consistently, and provide clear records. This process speeds up account balancing and helps rebuild trust without redoing every report.
4. Responding to shifting investor expectations
Investors now look at managers based on financial outcomes and non-financial metrics. This change pushes analysts to combine different types of data and timelines. Questions about sustainable investing need to connect emissions, supply chain risks, or social metrics to performance evaluation. However, these signals are infrequent and hard to compare.
The result is a difficult situation: you must demonstrate both competitive returns and solid ESG integration, while the underlying metrics are often unclear and inconsistently reported across issuers. The emotional impact is strong; it can be tiring to create stories that meet the needs of both performance-focused trustees and value-driven beneficiaries.
5. The rise of alternative assets
The rise of alternative assets brings new ways to handle liquidity, custody, and valuation that traditional systems were not made for. Digital assets and tokenized securities can settle at different times and locations than usual; their pricing might be low or outdated.
This means that realized profit and loss (PnL), unrealized values, and risk levels can differ from week to week, making regular ratios like Sharpe or drawdown misleading until everything is adjusted. You can think of this situation like trying to measure the speed of a river by looking only at a single whirlpool; thus, the local movement can hide the true current.
What is an analogy for today's performance analysis?
A good way to think about today's performance analysis is that it's like fixing a precise clock while the building it's in shakes during an earthquake. You can make accurate changes, but only if your tools are in sync, your parts can be traced, and your methods are quick.
What is the hardest part of performance analysis?
The annoying part is that this isn't even the toughest part to understand.
How to do Investment Performance Analysis in 10 Steps

You measure investment performance through a clear, repeatable process. Start by asking a question, then gather the correct data. After that, calculate returns carefully and compare them against risk, costs, and a suitable benchmark. By treating each step with care, you can turn confusing numbers into useful choices.
1. What exactly are we trying to prove?
Determining the analysis objective is essential before looking at the numbers. Are you testing pure return potential, the steadiness of returns, or how reliably the strategy survives stress? Consider the time frame: is it weeks, quarters, or decades?
Are you evaluating an active trading method that needs trade-level timing metrics, or a buy-and-hold allocation where long-term compounded growth is more important? The metrics you choose must map directly to that goal. If not, you might measure the wrong thing and end up confidently wrong.
2. How do we get clean, trustworthy data?
To obtain clean, trustworthy data, collect the beginning and ending portfolio values, every deposit and withdrawal, dividends and corporate actions, transaction dates for each trade, and all fees and commissions. This is often a failure point more than any math error. The challenge arises for both retail investors and advisory practices: unclear objectives and missing transaction records can render analysis useless.
It becomes exhausting when hours are spent reconciling a single cash flow. To avoid this, label each cash flow, keep timestamps, and maintain a raw, auditable ledger. This way, you can always rebuild the numbers from source documents.
3. Which return formula answers our question?
To answer our question, let's start with the simplest formula to check if our answer makes sense: total return equals ending value minus beginning value, divided by beginning value. When comparing multiple years, use CAGR to make direct comparisons easier.
For client-driven cash-flow accounts, use time-weighted returns to eliminate cash-flow timing effects. Also, use money-weighted return, or IRR, to show the real investor experience. Each method works as a diagnostic tool, not a final answer, because different questions need different returns.
4. What risk metrics tell the true story?
Track volatility as standard deviation to see how bumpy your returns can be. Measure maximum drawdown to find out the worst loss from peak to trough, and calculate downside frequency to know how often returns decrease. Don't stop there; check correlations between your holdings to see if losses pile up in one area or are spread out.
Remember, diversification isn't just a theory; it actually makes a difference. According to Holborn Assets Blog, "a diversified portfolio can reduce risk by up to 30% compared to a non-diversified portfolio," This number shows how your choices in allocation can really decrease volatility at the portfolio level.
5. How do we judge returns after accounting for risk?
To judge returns after considering risk, it's important to change raw returns into risk-adjusted figures. Calculate the Sharpe ratio for return per unit of total risk, the Sortino ratio for return compared to downside volatility, and the Calmar ratio to see how well returns were generated in relation to the worst drop. These measures help to distinguish lucky wins from repeatable skill. If a strategy shows high nominal returns but fails during tough times, these ratios will show that fragility.
6. Which benchmark should we use and why?
Pick a benchmark that shows the intended exposure, time horizon, and style. For broad stock investments, an index provides historical context; however, it's important to note whether the comparison is based on price return or total return. For active strategies, use a peer or style-specific index. Benchmarks create expectation bands; for instance, long-term stock performance can help define a reasonable goal.
According to the Holborn Assets Blog, "The average annual return of the S&P 500 over the past 90 years is approximately 9.8%." This historical baseline helps adjust growth expectations over decades rather than just quarters.
7. Why did performance happen, not just what happened?
To understand why performance happened, it's essential to run attribution to split returns into allocation effects, security selection, and timing. This process helps separate alpha from beta.
Break down winners into position-level contributors while identifying losers as stemming from structural issues or execution errors.
This diagnostic approach informs whether to change allocations, refine screening, or fix execution practices. Attribution serves as the map that transforms a surprising PnL into a set of targeted actions.
8. How consistent is performance over time?
To assess performance consistency over time, measure the win rate monthly or every 3 months. Compute rolling returns to spot trends and test behavior across different market situations to reveal sensitivity. Consistency often proves more valuable than occasional brilliance.
For example, if returns shoot up in one year and then disappear, it suggests that the strategy might depend on a temporary factor or luck. Therefore, it is essential to track performance in both rising and falling markets to understand overall survivability.
9. Have we accounted for everything that erodes returns?
Explicit fees should be removed, while slippage from regular bid-ask spreads should be estimated, and taxes should be planned for realistic turnover scenarios.
Many strategies might look profitable at first, but they can fail once these detriments are considered. It is important to create both worst-case and typical-case cost scenarios.
If the net return, after accounting for reasonable costs, is small, the strategy needs to be redesigned.
10. What will we do differently next month?
To improve next month, turn analysis into an action plan. This means getting rid of consistently underperforming investments, rebalancing to meet target exposures, changing risk limits, and writing down hypotheses to test in the next cycle. Also, the review schedule should match the strategy, and there should be a decision rule for each recurring issue. This way, analysis does not become routine with no impact.
When should you automate, and when should you keep it manual?
Determining when to automate versus keeping processes manual depends on the scale of operations. If a single account is managed and trading is infrequent, spreadsheets can suffice. However, as accounts, asset classes, or stakeholders increase, manual processes can fragment and lead to errors, ultimately slowing decision-making.
The common tendency is to piece together reports using ad hoc spreadsheets, which may seem quick. As complexity increases, these spreadsheets create reconciliation debtand discoverability gaps, leading to stressful late-night fire drills.
Platforms like AquaFunded centralize data connectors, standardize attribution definitions, and preserve auditable trails. This allows teams to compress reconciliation cycles from days to hours while maintaining full lineage for compliance.
How do we avoid common calculation traps?
To avoid common calculation traps, it's important to see where tools can mislead us. Stale pricing, inconsistent holiday calendars, and mishandled corporate actions can bias returns.
Running sanity checks, such as reconciling cash balances and comparing time-weighted and money-weighted returns, can help us spot discrepancies. When we see differences, it may signal data problems or unusual investor behavior.
Also, using rolling metrics can help stop us from overreacting to short-term noise. It's good to stress-test scenarios so that one single outlier doesn't change our overall strategy judgment.
What should we automate first?
Start with automating data ingestion and reconciliation before focusing on fancy dashboards. Clean inputs reduce downstream errors more effectively than visually appealing charts.
Next, automate standard metrics and drawdown detection to get early warnings. Finally, streamline attribution and report generation so humans can focus on interpretation and decision-making.
Are time-weighted returns the same as money-weighted returns?
To understand timing and returns, think of this analogy: time-weighted returns and money-weighted returns are like measuring a car’s engine performance compared to measuring fuel economy when driving with a trailer. One shows the machine's efficiency, while the other shows the real experience of the trip.
Why is this work often frustrating?
This work can feel technical and, at times, frustrating. That frustration often comes from trying to draw conclusions from imperfect information rather than facing tough choices. However, maintaining a strict approach to this process helps make decisions faster, clearer, and less emotionally biased.
What happens if you choose the wrong tool?
That method works until you choose the wrong tool. The right tool can change everything about how you read performance.
- Sources of Capital
- Cash Reserve Account
- Short Term Stock Trading
- Managed Account vs Brokerage Account
- Convergence Trading
- Liquidity Trading
- Futures Trading Minimum Account Size
- What is Drawdown in Trading
- How is Risk Involved in Calculating Profit?
- Systematic Trading
- How to Analyze a Stock Before Buying
- Forex Capital Trading
- Futures Trading Minimum Account Size
- What is a Retracement in Trading
- What is Automated Trading
10 Best Tools for Investment Performance Analysis
These ten platforms cover all types of needs for investment performance analysis. They go from easy portfolio tracking to high-level attribution and screening for professionals. It’s important to pick tools that fit your workload, data needs, and subscription choices. Below, each tool is explained, including its strengths and potential downsides, helping you match features to your actual workflow constraints.
1. Quicken
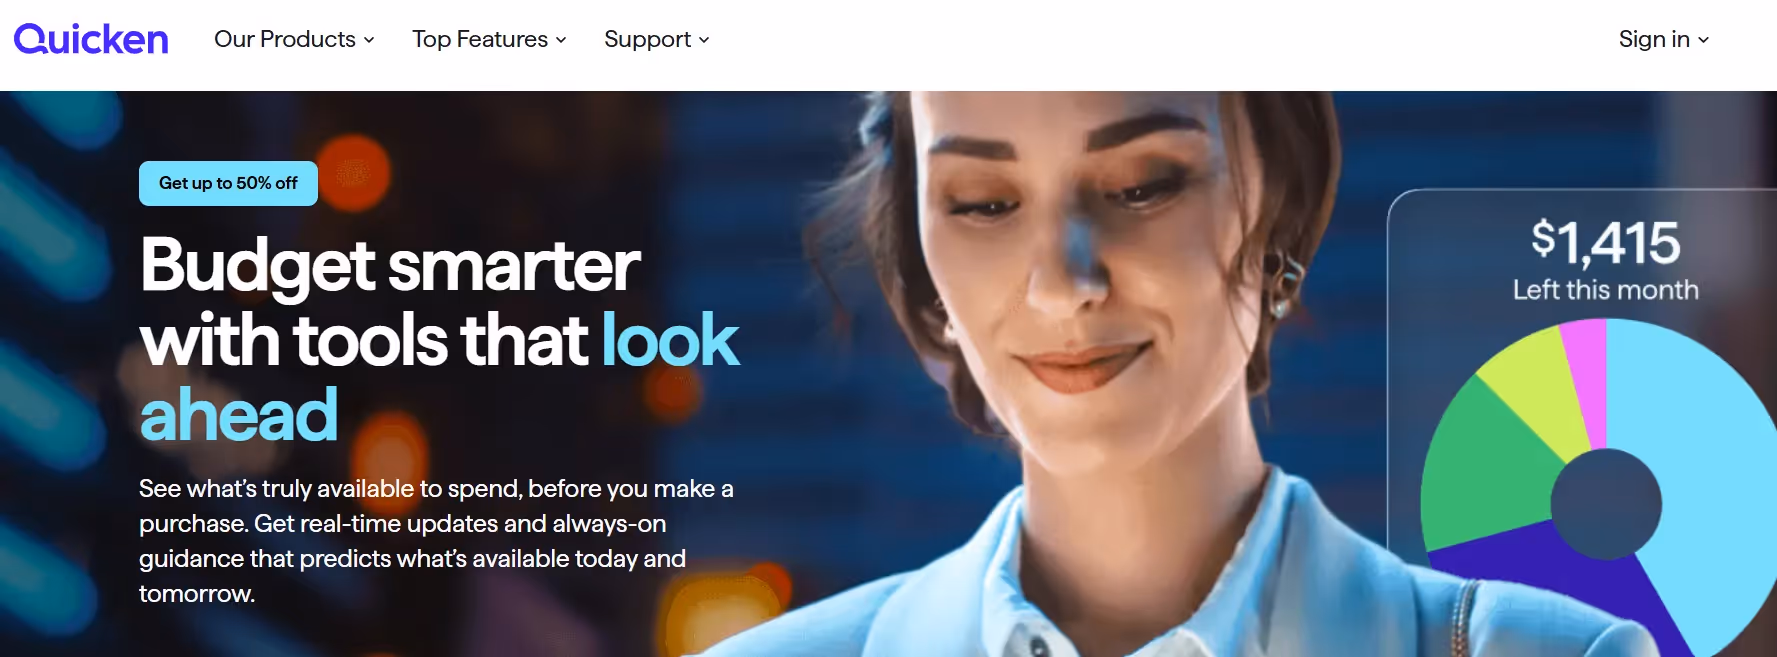
Quicken Premier combines detailed portfolio accounting with tax-aware cost basis tracking and live market pricing so you can reconcile holdings, dividends, and realized gains in one place. It syncs with many institutions and produces deep reports and customizable charts for ongoing reviews.
Pros
- Very detailed, customizable reporting
- Historical data import and strong reconciliation features
- Responsive customer support and wide institutional connectivity
Cons
- Ongoing subscription required, which some users find burdensome
- Not built for complex, non-traditional assets or highly active trading
2. Ziggma
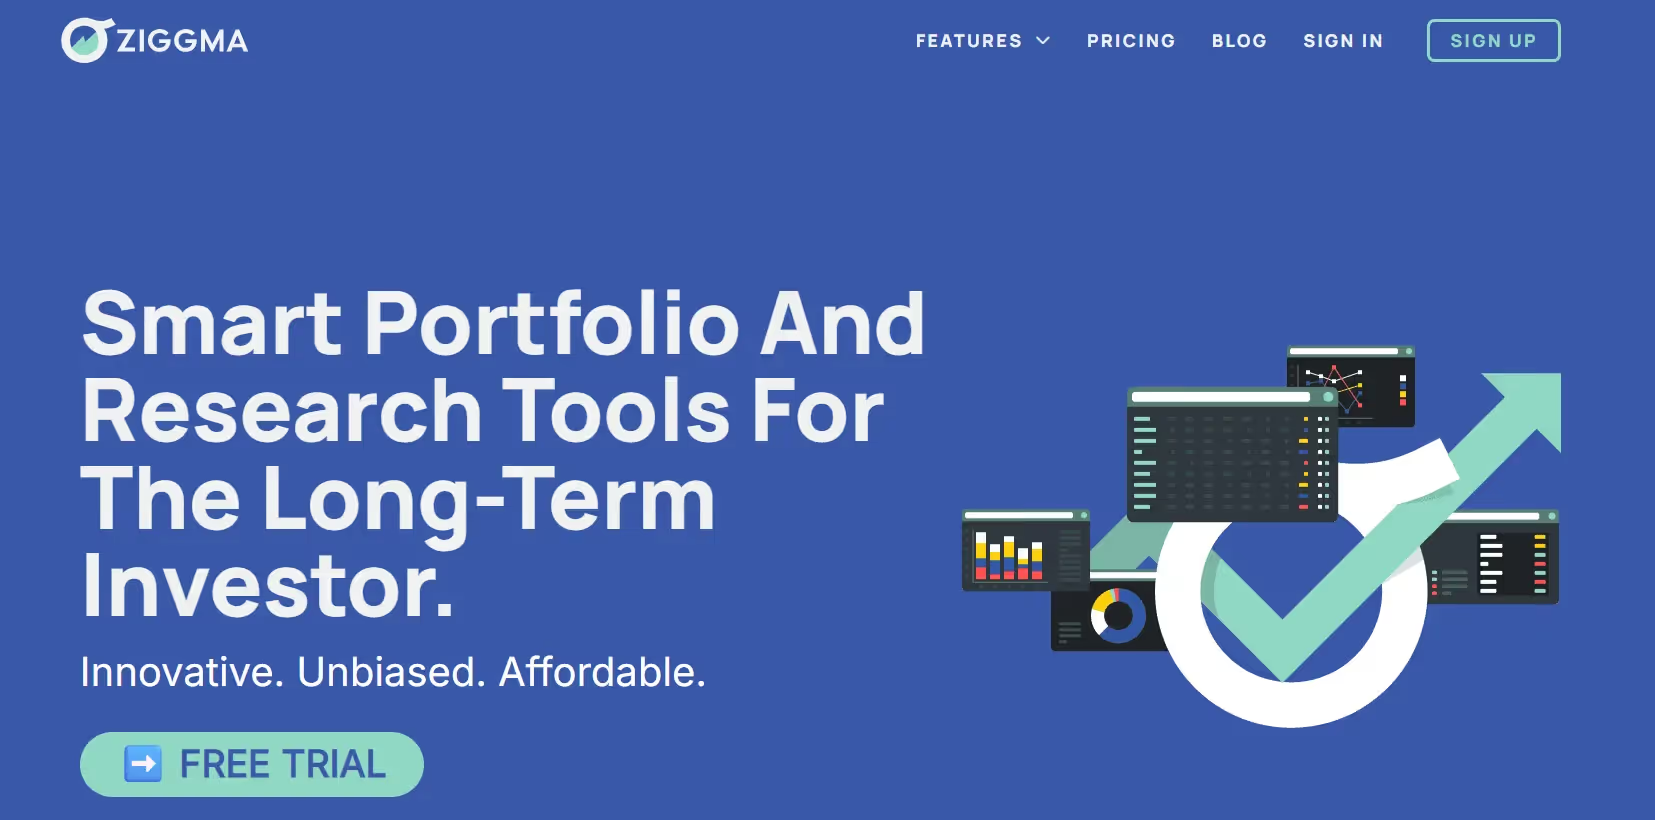
Ziggma focuses on affordable portfolio optimization and concise scoring, giving cost-conscious investors algorithmic ratings and a compact simulator to test allocations without a heavy interface. The free tier covers basics; paid tiers add account linking and ad-free use.
Pros
- Good portfolio optimization tools and scoring
- Lightweight portfolio simulator and clear tracking
- Low-cost tiers for budget-minded investors
Cons
- Limited advanced screening compared with premium platforms
- Support options are smaller and less hands-on
3. Sharesight

Sharesight is built for self-directed investors who need global tracking and solid tax reporting. It handles multiple markets, supports dividends and corporate actions, and generates benchmarked performance and tax reports.
Pros
- Strong international support and benchmarking
- Good tax reporting for cross-border holdings
- Flexible pricing tiers to suit different users
Cons
- Uploading and reconciling brokerage transactions can be slow or awkward
- No built-in trading execution; it is analytics-only
4. Kubera

Kubera serves as a polished net worth and asset tracker, aggregating banking, brokerage, crypto, real estate, and even domain valuations into a single, clean dashboard. It relies on multiple aggregators for accurate updates and securely stores estate documents.
Pros
- Single-pane aggregation of diverse asset types
- Clean interface and multi-aggregator connectivity for reliability
- Crypto wallet and exchange support, plus property valuation tools
Cons
- Lacks in-platform security research and stock-level analytics
- Not focused on deep attribution or factor analysis
5. Monarch Money
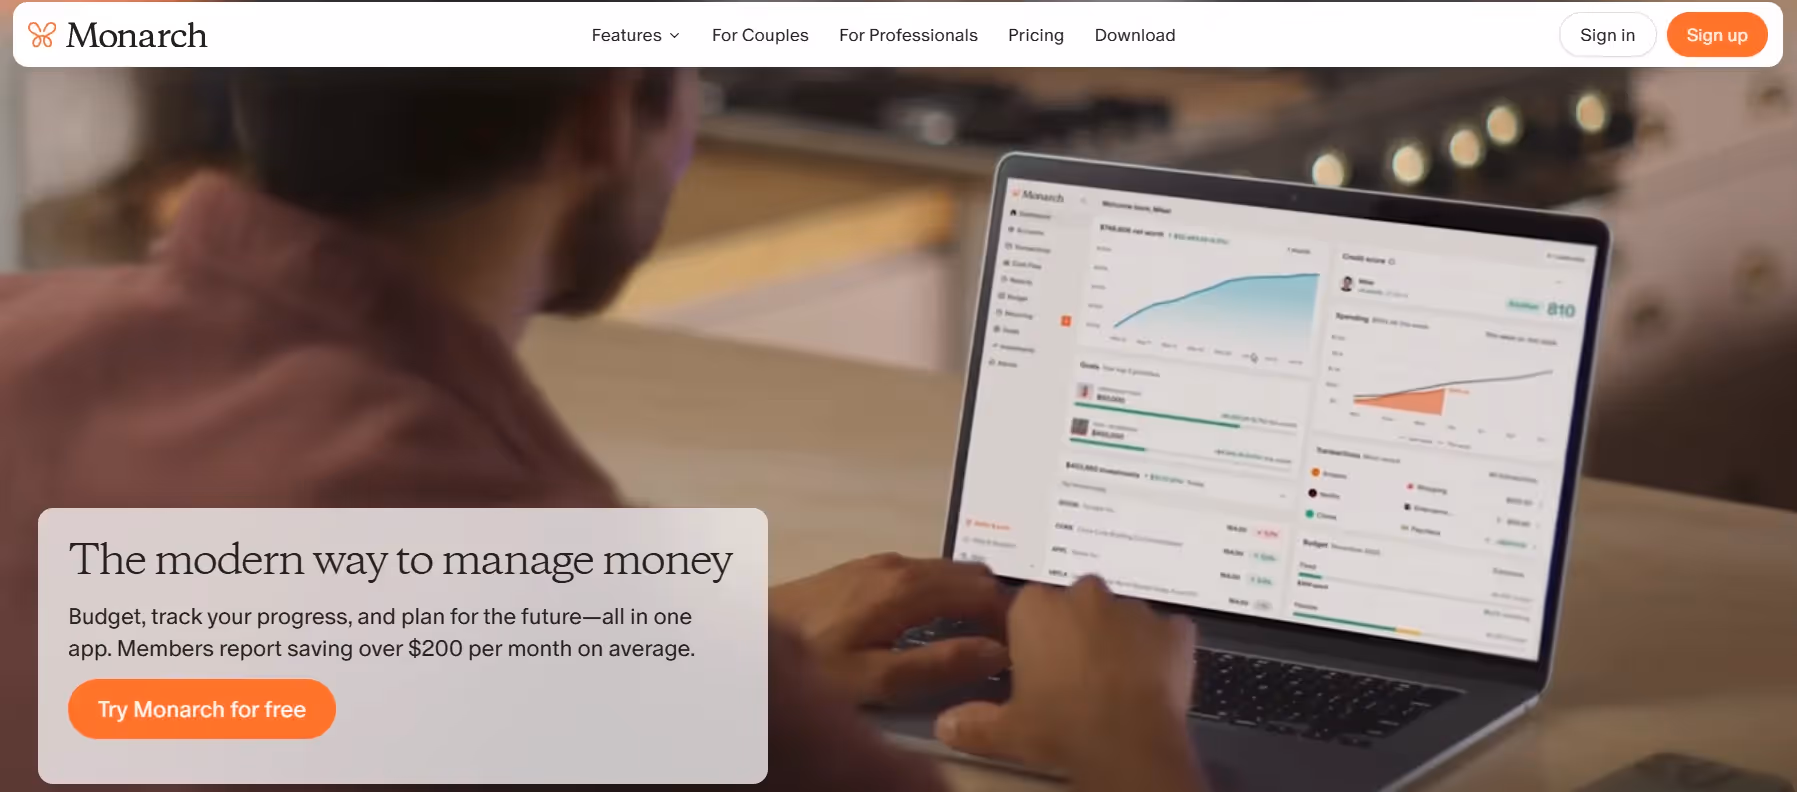
Monarch is primarily a budgeting and goals app that also tracks investment balances and returns. It blends cash flow visibility with basic investment tracking, so households can see budgets and portfolios side by side.
Pros
- Excellent budgeting and recurring expense tracking
- Integrates investment balances into broader financial goals
- Simple, user-friendly flows for households
Cons
- Investment analysis features are limited compared with specialist tools
- Asset allocation insights are basic
When we onboarded retail clients over the past 12 months, a consistent pattern appeared: subscription fatigue matters. Several clients declined auto-renewal of tools like Quicken because ongoing fees felt like a hidden cost, and others abandoned feature-rich platforms because complexity outpaced their needs. That tension between depth and cost explains why many choose a mix of one free aggregator and one paid research tool.
6. Morningstar Investor

Morningstar Investor exposes professional-grade research to individual investors, including the X-Ray style analysis that decomposes funds and portfolios by holdings, style, and risk factors. It pairs detailed reports with robust screeners for funds and stocks.
Pros
- Extensive research library and customizable reporting
- Professional-level X-Ray style portfolio decomposition
- Strong fund and stock screening capabilities
Cons
- Personal finance features are minimal
- The monthly fee can feel steep for smaller accounts
7. Stock Rover

Stock Rover is a data-dense platform built for investors with complex equity portfolios. It offers exhaustive fundamental data, screening, alerts, model portfolios, and automated account linking for continuous monitoring.
Pros
- Very powerful reporting and charting for equities and ETFs
- Connects to brokerages for automatic updates
- Dividend calendars, analyst data, and many prebuilt templates
Cons
- Noticeable learning curve, especially for new users
- The interface can feel overwhelming until you learn the workflows
8. Fidelity Full View

Fidelity Full View provides deep, frictionless syncing for Fidelity clients and lets users consolidate external accounts for net worth and cash flow analysis. It is most convenient for existing Fidelity customers who want a no-cost, automated snapshot.
Pros
- Excellent connectivity for Fidelity accounts and many external accounts
- Built-in calculators and clear cashflow views
- No additional cost for Fidelity clients
Cons
- Limited advanced investment analysis and attribution reports
- Exclusive access for Fidelity account holders
9. Snowball Analytics
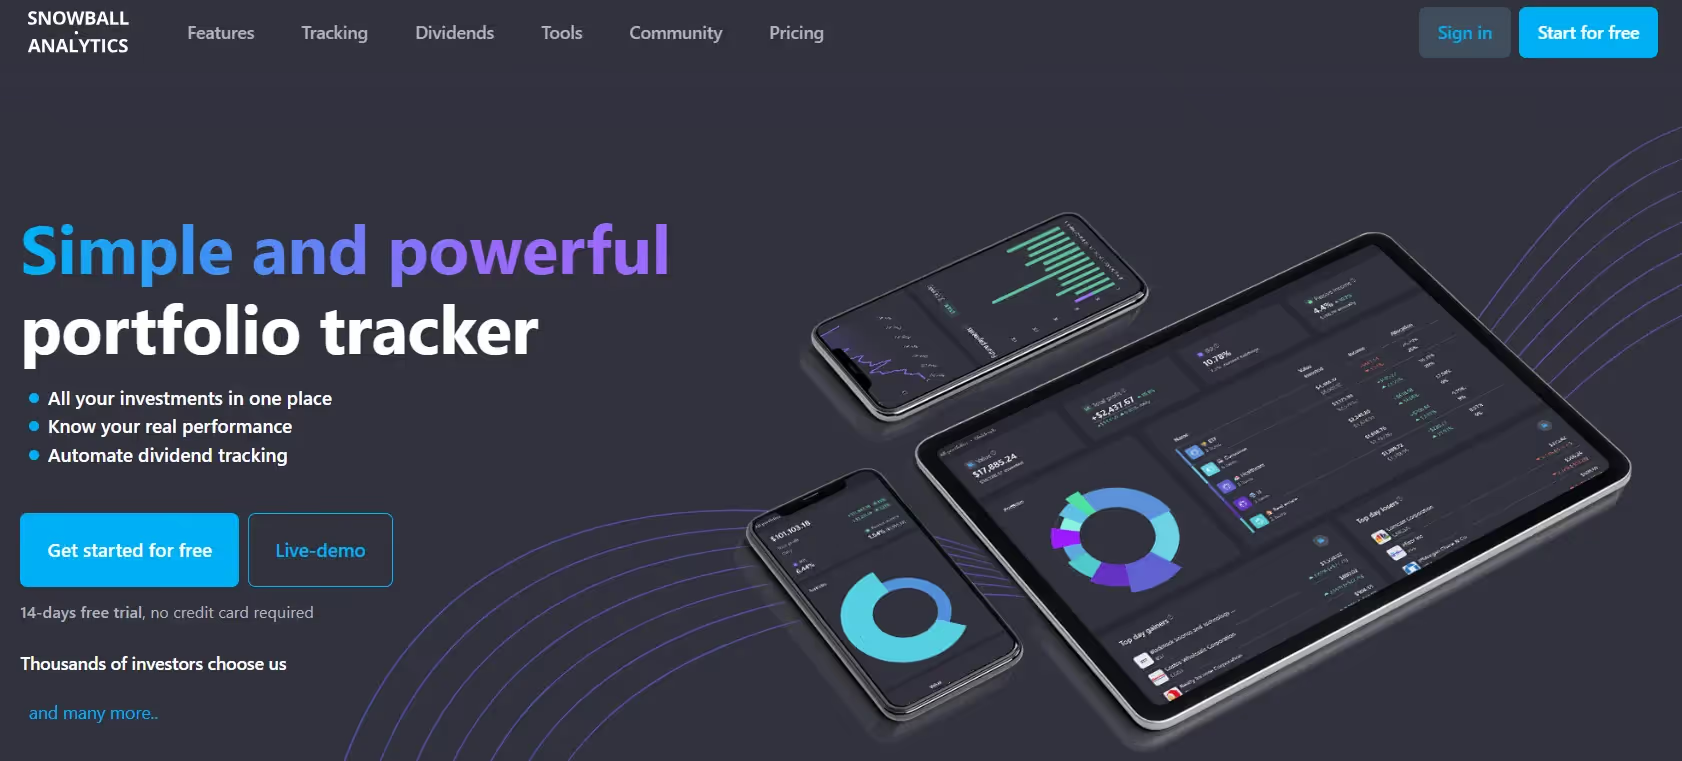
Snowball focuses on clarity and income forecasting, offering a tidy dashboard that highlights allocation, past performance, dividend estimates, and an income projection engine. It supports both linked accounts and manual input.
Pros
- Intuitive layout and straightforward dividend and income projections
- Free tier plus reasonable paid plans
- Clear asset allocation and upcoming dividend calendar
Cons
- Expert tier pricing climbs for active users
- No dedicated retirement-planning module
10. Simply Wall St.
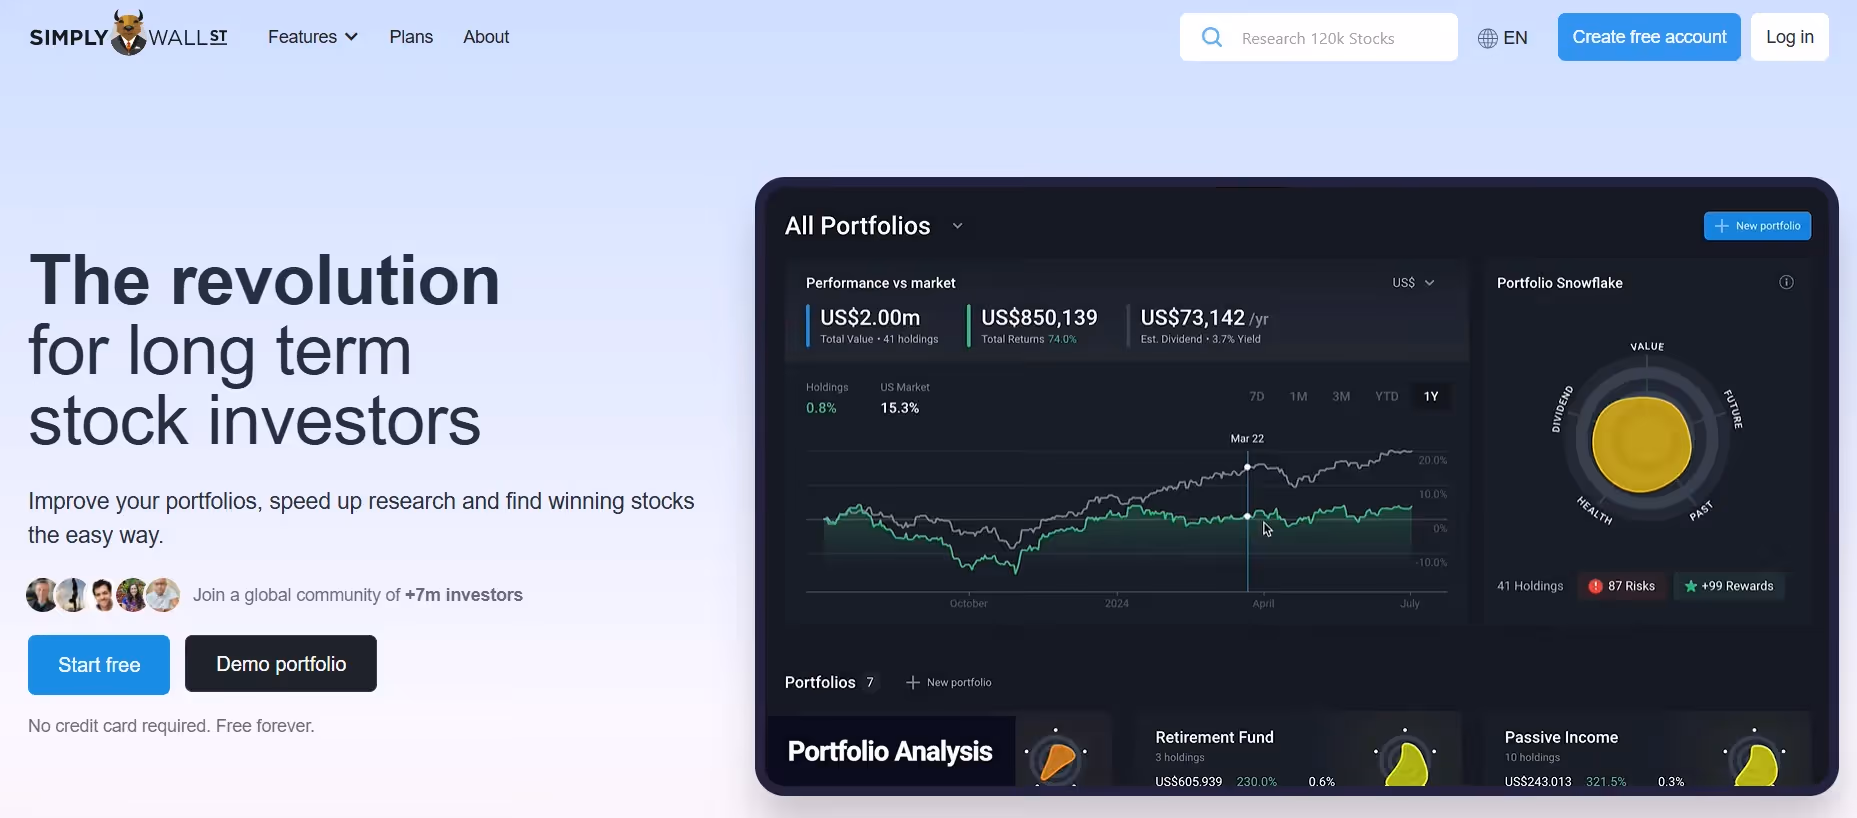
Simply Wall St simplifies stock and ETF evaluation with visual reports and metrics that turn financial statements into clear, actionable snapshots. It covers many brokers globally and is ideal for equity-focused investors.
Pros
- Deep, visualized returns and valuation analysis for stocks and ETFs
- Supports account linking or manual portfolios
- Easy-to-read key metrics and peer benchmarks
Cons
- Does not support mutual funds, a major limitation for diversified portfolios
- No native asset allocation overview
How do tools impact investor adoption and outcomes?
Adoption and outcomes are very important for deciding which tools an investor should use. To give some context, the Finzer Blog reports that 85% of investors use at least one stock analysis tool. This widespread use helps explain the finding that over 70% of users reported improved investment performance after using analysis tools, according to the Finzer Blog.
What are the challenges of using spreadsheets for reporting?
Most teams put together reports using spreadsheets because they are comfortable with them, not because they work well for larger needs. This method might be okay for a few accounts, but as cash flows, custodians, and stakeholders increase, the problems become clear. Manual reports can become scattered, leading to longer reconciliation times and slower decision-making.
Solutions like AquaFunded offer ready-made connectors, clear attribution definitions, and traceable records. This allows teams to reduce reconciliation time from days to hours while maintaining consistent metrics and data.
How should investors select the right tools?
A quick analogy: choose a tool the way you choose a wrench for a job, rather than selecting the whole toolbox. If you need a quick household checkup, a budgeting app with light investment tracking will suffice.
For more complex tasks, such as explaining attribution to a client or running peer-relative analytics, select a platform designed specifically for attribution and screening. Mix and match your tools deliberately, rather than by accident.
What constraints should influence tool selection?
The choice of tool usually depends on three important factors: how many accounts you are managing, how detailed the attribution needs to be, and how sensitive you are to ongoing fees. First, figure out these factors. After this assessment, choose one aggregator and one specialist for research so that each tool has a clear purpose.
What fears do investors have when testing strategies?
While the surface may seem tidy, what investors truly fear is testing strategies in live markets with real dollars. This anxiety comes from several underlying concerns.
The next paragraphs will explore why this fear keeps happening and what most people often overlook.
Struggling to Test Your Trading Strategy Without Risking Capital?
If testing your strategy with real money feels risky and makes it hard to analyze your investment performance, consider AquaFunded.
With fully funded accounts up to $400K, flexible rules, easy profit targets, fast payouts, and up to 100% profit split, you can measure your true returns accurately.
This helps you control attribution and drawdowns better while keeping the upside without risking your own money.
Join our funded trading program.
Related Reading
- How To Take Profits From Stocks
- Accumulation Distribution
- Short-Term Capital Gain Tax On Shares
- What Is Reit Dividends
- Cash Available To Trade Vs Settled Cash
- Best Pairs To Trade Forex
- Can You Day Trade In A Roth Ira
- What Is A Conditional Order
- Orb Strategy Trading
- Stop Loss Vs Stop Limit
- Flag Pattern Trading
- Characteristics of Growth Stocks
- Forex Compounding Plan
