


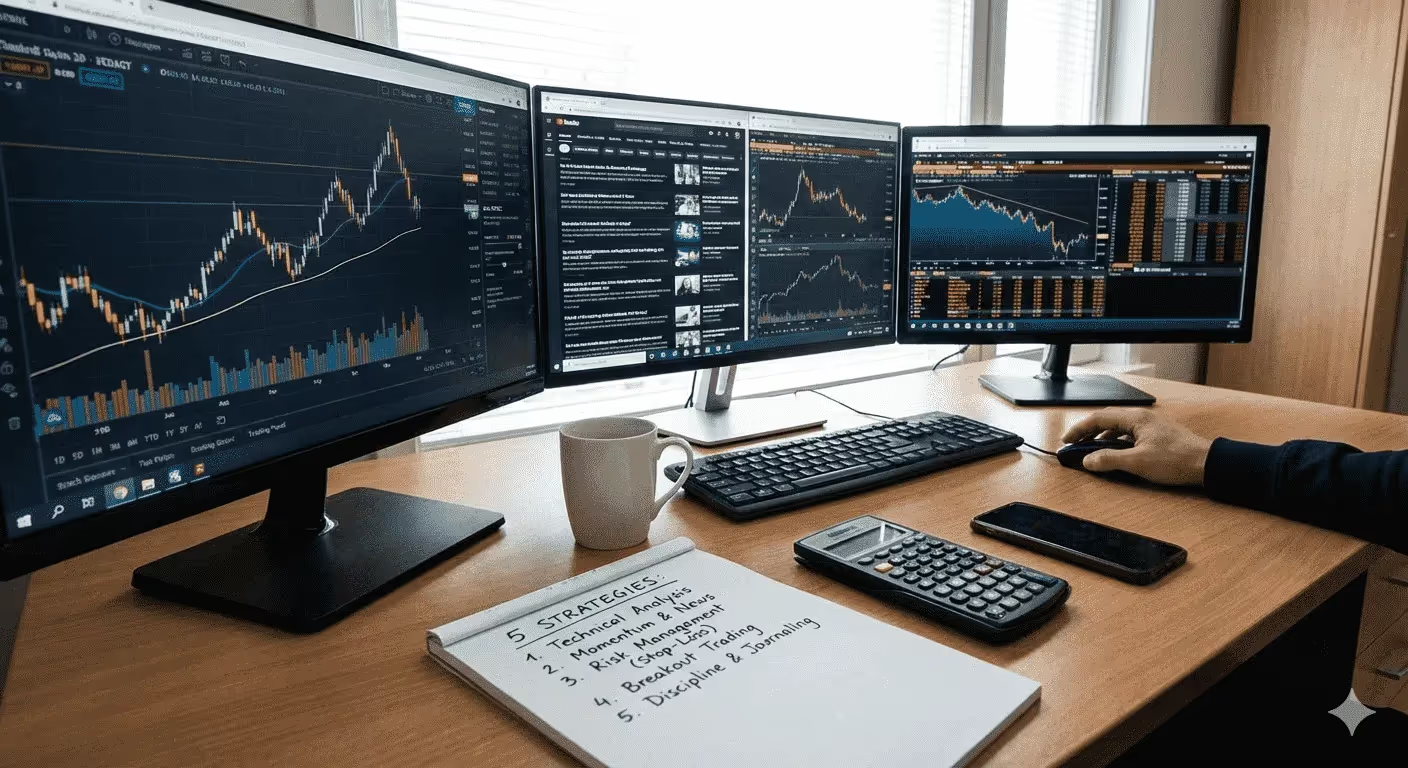
Risk Management in the ORB Strategy Trading
ORB Strategy Trading demands precise risk management. Learn position sizing and stop loss tactics with AquaFunded to safeguard your trades.
Trading with the Opening Range Breakout strategy can offer an edge when effective position sizing, stop-loss placement, and capital preservation techniques are in place. Many traders naturally ask, 'what is a funded account?' as they explore ORB Strategy Trading and seek ways to secure capital while managing risk. Effective risk management during the market’s opening moments sets a foundation that balances profit potential against drawdowns.
Applying these techniques in a live setting equips traders to turn theory into tangible results. Discipline and consistent risk control are key to preserving capital and building trading confidence. These principles enable traders to navigate volatile markets while fine-tuning their approach. AquaFunded’s funded trading program provides the tools and real capital needed to advance a risk-aware trading strategy.
Summary
- Opening Range Breakout strategies deliver measurable returns when executed with discipline, generating a 433% return over the last year according to systematic traders who combined proper position sizing with consistent entry rules. The edge comes from following a repeatable process that captures momentum when it appears and limits losses when it doesn't, not from predicting market direction better than anyone else.
- False breakouts represent the primary reason 90% of day traders lose money, as market makers and institutional traders actively hunt liquidity at predictable levels where retail traders cluster stop losses just beyond the opening range. Every breakout that triggers your entry and immediately reverses isn't a mistake in your execution; it's the structural reality that many breakouts exist to trap traders before reversing.
- Position sizing anchored to 1-2% account risk per trade creates mathematical resilience, helping you survive the inevitable losing streaks. Ten consecutive losses at 2% risk leaves 82% of your capital intact, while ten losses at 10% risk destroy your account entirely. The calculation happens after you identify your stop distance, never before, which forces you to trade a smaller size when volatility expands and stop distances widen.
- Volume confirmation eliminates weak breakouts by requiring at least 150% of the previous 20-candle average volume during the breakout candle itself. Price can break any level, but moves without volume expansion typically represent single large orders or algorithmic noise rather than genuine directional conviction from multiple market participants.
- Most funded trading programs emphasize risk management over profit generation, rewarding traders who demonstrate consistent drawdown control across multiple trades rather than chasing profits during chaotic market conditions. Proving you understand when not to trade matters more than knowing when to enter, because protecting capital during volatile periods separates systematic traders from gamblers.
- AquaFunded's trading program addresses the capital access challenge by providing accounts up to $4M to traders who can execute strategies like ORB with consistent risk management, allowing you to trade early-session volatility with institutional capital instead of risking personal savings during the learning curve.
What is ORB Strategy Trading
The Opening Range Breakout strategy capitalizes on the market's initial uncertainty by waiting for the price direction to become clear. Traders then enter trades when momentum shows a definite path. You mark the high and low of a specific opening period, usually the first 30 minutes after the market opens. A long position is taken when the price goes above that range, while a short position is started when it goes below. The beauty of this strategy is its simplicity: entry points, exit targets, and stop losses are all set in advance. This method removes the gray area that usually confuses most intraday traders. If you're considering participation, our funded trading program can help facilitate your trades effectively.
This strategy isn’t about guessing where the market will move; it’s about noticing when the market has already made a decision. By placing yourself to take advantage of that momentum, you can navigate through the confusion of differing opinions in the first moments after the market opens. Institutional orders compete with retail enthusiasm, and news reactions clash with adjustments from the previous night. Instead of trying to outsmart this chaos, you wait for it to settle into a direction and then follow the strongest trend.
What happens during the observation period?
When U.S. stock markets open at 9:30 AM EST, you start your clock. Most traders use a 15-minute observation window, but some prefer 5 minutes for quicker signals or 30 minutes for more reliable confirmation. During this time, you’re not trading. You’re watching the price set its boundaries. The highest point reached becomes your upper breakout level. The lowest point becomes your lower breakout level.
Once the observation period ends, traders switch to execution mode on a faster timeframe, usually using 1-minute or 3-minute charts. They look for a candle to close decisively beyond either boundary. A close above the high shows bullish momentum worth riding, while a close below the low shows bearish pressure worth following. The closing price is more important than wicks or intraday spikes because it shows where buyers and sellers agreed to trade, not just where they tested the market.
How do you manage risk and stop loss?
A stop loss is placed just inside the opening range on the opposite side of where you enter. For example, if you are going long on an upside breakout, the stop loss is set slightly below the range low. On the other hand, if you are going short on a downside break, the stop loss sits slightly above the range high. This sets a clear risk boundary: if the price moves back into the opening range, the original idea is considered wrong, and you should exit before losing more.
This strategy uses a repeatable pattern in how traders think. At the start of trading, participants review overnight news, respond to pre-market movements, and adjust their positions based on new information. This creates volatility without a clear direction. As different groups test levels and set their positions, prices rise and fall, revealing the balance between buyer and seller sentiment.
What happens after a breakout?
Markets hate uncertainty. Within minutes, one side usually takes control. Either buyers absorb all the available selling pressure and push prices higher, or sellers overwhelm buying interest and push prices lower. When the price breaks beyond the opening range with conviction, it shows that this direction has gained support.
Other traders see the same breakout, which starts a self-reinforcing cycle. Momentum attracts momentum. Defined entry and exit rules solve the biggest problem for discretionary traders: emotional interference. Traders do not need to guess if a move is "big enough" to follow or wonder if they should wait for a pullback. The breakout either happens or it does not. Your stop loss either triggers or it does not. This clear system removes the hesitation that often comes with too many choices in fast-moving markets.
How does the observation period affect trade?
According to Trade That Swing, the systematic application of ORB principles generated a 433% return over the last year when combined with proper position sizing and disciplined execution. This performance did not come from better market-direction predictions. Instead, it came from following a repeatable process that captured momentum when it was there and limited losses when it wasn’t.
The observation period chosen greatly affects how the strategy works. For example, a 5-minute opening range produces more trading signals but can also lead to more false breakouts. Price often hasn't had enough time to form a truly meaningful range, which means breakouts can reverse quickly. This method helps traders who want multiple chances each session and can handle a lower win rate in exchange for catching occasional explosive moves.
What is the balance in the observation time?
A 15-minute range strikes the balance most traders prefer. It gives enough time for initial volatility to settle while also capturing most of the important directional moves. The range is wide enough to filter out noise, but not so wide that real breakouts become rare. Traders might see one to three quality setups per session across a watchlist of active stocks.
A 30-minute or 60-minute opening range produces fewer signals but is more reliable. When the price breaks a one-hour range, there is usually significant volume and strong conviction behind the move. False breakouts decrease, but you lose some frequency. Some days may have no valid setups. This works well for traders who prefer patience over activity and value quality over quantity.
How does the strategy apply to different assets?
The strategy adapts across asset classes with minor adjustments. Stocks, futures, forex, and crypto all exhibit opening-range behavior, though thetiming varies. Forex markets don't have a single 'open' time, but they show increased volatility during session overlaps, such as those between London and New York. Crypto trades 24/7, often moving in one direction around traditional market opens when institutional participants engage. The core principle remains: identify a period of consolidation, then trade the breakout with predefined risk.
Most traders who fail with opening range breakout (ORB) make one of two mistakes. They either enter too early, jumping on moves before the opening range actually completes, or they chase breakouts without confirming closes beyond the boundary. A wick that touches above the high is not a breakout, while a candle that closes above it is. This important distinction separates systematic traders from gamblers.
What should traders accept about ORB?
The strategy requires acceptance that not every session will go as planned. Some days, the price may chop inside the opening range for hours, not creating a valid signal. On other days, a breakout may quickly reverse, leading to a small loss. The main advantage comes from consistency across hundreds of trades, rather than aiming for perfection with any one setup. When disciplined entries are paired with proper position sizing, the winning trades can more than make up for the losses you will have.
For traders with limited capital, ORB gives a way to show skill without needing a large account. Programs like AquaFunded assess traders on how well they follow rules and manage risk, not on how much personal money they have. Their instant funding model rewards traders who can execute strategies like ORB with discipline, offering access to accounts up to $4M while allowing them to keep a large share of the profits. Your skill becomes an asset, and their capital becomes a tool.
How do traders set profit targets?
The opening range itself gives the first reference for profit targets. Many traders aim for a move equal to the range's height. If the opening range is $2 (from $48 to $50), they target a profit of $2 from their entry point. This sets up a sensible risk-reward ratio: if the stop is $1 away and the target is $2 away, the risk is one to make two.
More aggressive traders set multiple profit targets. They take some profits at 1x the range height while letting the rest run with a trailing stop. This strategy secures gains while allowing them to catch extended moves. On the other hand, conservative traders exit completely at their first target, accepting smaller wins in exchange for higher-probability outcomes.
What is crucial for consistent trading?
The key is consistency. If you keep changing your exit strategy based on emotions, you are not following a system. Instead, you are trading your feelings, which is exactly what ORB is designed to prevent. Choose your profit target methodology, backtest it against historical data for your selected markets and timeframes, and then execute it consistently every time. However, knowing how everything works is just the start. The real challenge is surviving the times when ORB does not perform as you expect. Understanding the benefits of a funded trading program can provide additional support in these circumstances.
Related Reading
- How to Grow a Small Trading Account
- What is Trading Commodities
- Long Term Trading Strategy
- Capital Growth Strategy
- What is a Cash Account in Trading
- What is Compound Trading
- How Much Money Do You Need to Start Trading Stocks
- Scale Trading
- Small Account Trading
- How to Evaluate Investment Opportunities
- Blown Trading Account
- What is PNL in Trading
- Do Prop Firms Use Real Money
- Prop Firm Account Management
- Borrowing on Margin
- Trading Leverage
Challenges of ORB Strategy Trading

Every systematic approach looks elegant on paper until you start executing it with real money in real time. ORB offers clear rules, but those rules clash with market realities that test your discipline in ways backtests never reveal. The difference between understanding the strategy and handling its toughest moments separates traders who build consistency from those who quit after a rough week. To navigate these challenges, many traders consider a funded trading program that provides the necessary capital and support to thrive.
The hardest part of ORB isn't just losing trades; it's losing trades that seemed perfect when you entered. When the price breaks the opening range with strength, and the trader enters as planned, the momentum can disappear quickly. Within minutes, the price reverses back into the range, causing a stop out. This happens a lot because market makers and institutional traders actively seek liquidity at predictable levels. They know that retail traders often place stop losses just beyond the opening range, which pushes the price through those levels to trigger exits before reversing direction.
What are the common pitfalls when trading ORB?
Research from Fortunly shows that 90% of day traders lose money, and false breakouts are a major reason. You're not making mistakes when these trades fail. You're facing the fact that many breakouts are designed to trap traders rather than show real directional moves. The opening range acts like a magnet for stop hunting because everyone sees the same levels. While confirmation filters can help, they also bring their own problems. Waiting for a retest of the breakout level can cause traders to miss the biggest moves. For instance, the need for volume expansion introduces subjectivity into an otherwise clear system. Requiring multiple closes beyond the range makes good setups less common.
Every filter added reduces false signals, but also decreases the opportunity. The challenge isn't about finding the perfect filter, but about accepting that some entries will inevitably trigger stops. Position sizing must consider these inevitable losses to avoid ruining your account.
How does market behavior affect ORB trading?
The market open concentrates an entire day's worth of emotional intensity into thirty minutes. Candles that would take hours to form during midday sessions appear in seconds. Spreads widen, and slippage can turn a planned entry at $50.10 into an actual fill at $50.18. Furthermore, a stop at $49.90 might trigger at $49.82 because market orders execute at the available price rather than the intended price. This environment punishes hesitation and rewards speed, creating a psychological trap. With pressure to act quickly, traders may enter positions before confirmation. A massive candle can create an assumption that the breakout is real, leading them to skip their checklist.
One impulsive entry often results in a stop out, triggering frustration and prompting revenge trading on the next setup. As a result, within an hour, traders might break every rule that makes ORB effective. Beginners struggle the most because they lack reference experiences. They haven't encountered enough false breakouts to tell the difference between real momentum and temporary volatility. This means every large candle feels important, and every breakout looks like it will start a trend. This emotional intensity overwhelms their ability to follow rules, leading them to make decisions based on feelings instead of what the price action actually shows.
What external factors disrupt ORB strategies?
ORB assumes normal market conditions in which price action reflects supply and demand dynamics. However, markets don't always cooperate. An unexpected economic report may come out just fifteen minutes after the open, making your carefully marked opening range useless. Earnings announcements can create gaps that cause your stop loss placement to fail. Additionally, geopolitical events can cause moves that ignore all technical levels.
This strategy is not ready for such disruptions because it cannot account for them. Traders must either avoid trading on known event days, such as earnings releases, Fed announcements, and major economic indicators, or accept that some trading sessions will result in losses unrelated to how well they executed trades. Many traders do not realize this difference, treating event-driven losses the same as execution mistakes. This confusion leads to unnecessary changes in strategy and ultimately decreases confidence.
How can strategy evaluation improve success?
The discipline required here isn't just about better analysis; it involves accepting that some trading days should be skipped entirely. Programs like AquaFunded evaluate traders partly on their ability to recognize when conditions don't suit their strategy. Their instant funding model rewards consistency over mere activity. This means knowing when not to trade is as important as knowing when to enter. You're showing skill through restraint, not just through winning trades.
ORB requires stops near the opening range to maintain good risk-reward ratios. If the range is $2 and you place your stop $1 away, you can aim for $2 or more in profit while keeping a 1:2 risk-reward setup. However, tight stops can create a technical issue, especially during market noise at the open. Random wicks might spike through levels without showing any clear direction. For instance, if your stop is set at $49.90, the price could dip to $49.88 for 3 seconds, stopping you out, only to rise to $ 51.50 shortly after.
What should be considered for stop placement?
This isn't bad luck; it's the cost of trading during volatile periods with defined risk. Wider stops reduce early exits but harm your risk-reward ratio. If you risk $2 to make $2, you need a win rate above 50% just to break even after commissions. The tighter your stop, the more often it triggers, but it can improve your ratio when trades are successful. On the other hand, the wider your stop, the fewer false exits you have; however, it becomes harder to achieve positive expectancy.
Most traders respond by constantly adjusting their stop placement, which removes any statistical advantage the strategy might have. One day, they use tight stops; the next, they give more room. The following day, they might try a trailing stop from entry. This inconsistency makes it hard to evaluate whether the strategy works because traders never execute the same approach long enough to create meaningful data.
What impacts the effectiveness of ORB?
ORB performs best when markets trend. A strong directional bias helps the price move well beyond the opening range, allowing your position to reach profit targets with room to spare. However, many days do not trend. Price moves back and forth within a range, briefly breaks out, reverses, breaks in the opposite direction, and then reverses again. You enter the first breakout and get stopped out; you enter the second breakout and get stopped out again. By midday, you've taken three losses on a strategy that only generates one or two signals per session.
The challenge of pattern recognition is knowing which days will trend before the session begins. Some traders use pre-market volume, overnight price action, or broader market context to filter for high-probability days. Others simply accept that ORB will create losing sessions and depend on winning days to make up for it. Both approaches can work if done consistently; however, neither works if you keep switching between them based on recent results.
Why is discipline crucial for ORB trading?
Forcing trades on choppy days can ruin more accounts than false breakouts. You see the opening range, know the rules, and feel you have to join in because you're an ORB trader. However, the strategy does not need daily trades. It needs trading only when the conditions match the strategy's assumptions. Choppy, range-bound days do not meet those assumptions, so the disciplined choice is to avoid trading.
The simplicity of ORB creates a deceptive sense of ease. The rules fit on an index card, with entry, stop, and target all set in advance. There's no discretion, no complicated analysis, and no room for interpretation. Yet, traders fail with ORB at the same rate they do with more complicated methods because knowing what to do and actually doing it are totally different skills.
What additional rules challenge ORB traders?
Traders must work within certain time frames, which means they have to ignore setups that show up later in the session, even if they look like their morning entries. Late entries should be avoided, and this can be frustrating when prices move without them after missing the first breakout by just thirty seconds. Also, traders need to accept small losses quickly. This takes discipline to exit positions that seem like they could bounce back if given just a bit more time.
Every time a rule is broken, it might feel justified at that moment. The late entry might seem too tempting to resist. A position close to the stop-loss could turn around if they wait. The choppy day might change into a trend if they just show a bit of patience. These justifications add up over time, leading traders away from the standard ORB strategy. In the end, they are using a discretionary approach, treating ORB levels as flexible guidelines, which reduces the statistical advantage that made the strategy successful in the first place.
How does trader psychology affect ORB success?
Most traders break their rules after one or two losses because they haven't internalized that losing trades are part of the process, not evidence of failure. They see a stop out and assume something went wrong, so they change their approach to avoid that specific loss in the future. This creates a cycle in which the strategy constantly changes based on the most recent outcome, preventing consistent execution across a meaningful sample size.
The strategy performs differently across markets, but many traders find this out only after weeks of frustration. High-volume stocks and major indices show clear opening ranges with strong breakouts because thousands of participants create real price discovery. On the other hand, low-liquidity pairs and obscure crypto assets produce unpredictable opening ranges, where a single large order can trigger a breakout unrelated to directional bias.
Why is asset selection important in ORB?
You can execute ORB perfectly and still lose consistently if you're using it on assets that don't exhibit the behavior the strategy exploits. The problem isn't with your discipline or timing; it's the market you picked, which may not have enough activity in the opening period to create meaningful price ranges. Without this activity, breakouts can become random rather than move in a particular direction.
Testing the strategy on different assets before using real money can help with this problem. Sadly, many traders skip this step. They read about ORB, choose a market they're already familiar with, and start trading without checking if the approach really works in that specific situation. When their results are poor, they often blame the strategy rather than realizing their method doesn't align with the market.
What happens when traders make adjustments without testing?
After a series of losses, the urge to change the strategy can be very strong. Traders might start experimenting with different opening-range durations and adding indicators to confirm breakouts. They create rules for different market situations, thinking these changes will improve their approach. However, each change can lead to backtest results that appear good, as the strategy ends up being fitted to past data rather than building a robust plan for future uncertainties.
This curve-fitting creates strategies that may look great in historical tests but often do not work well in live trading. Such strategies get optimized for noise rather than signal. The original ORB approach remains effective due to its simplicity, which helps it remain stable across different market conditions. On the other hand, an over-optimized version works only under the specific conditions present in the backtest period, which are seldom repeated exactly.
How to maintain a consistent approach with ORB?
The real edge in ORB comes from consistently executing a simple rule set, not from finding the perfect parameter combination. Every extra filter or condition increases the chances of optimizing for randomness. The strategy that seems best in backtests often performs the worst going forward, as it has been adjusted to catch accidents rather than patterns. Understanding these challenges conceptually does not prepare you for the moment of facing a third consecutive stop loss in the morning. The dilemma arises: should you skip the next signal or change the current approach?
How to Trade in the ORB Strategy

The execution layer of the ORB strategy requires confirmation of breakouts through closed candles, not wicks or momentary spikes. Traders should wait for the price to settle beyond the opening range boundary. Entry should occur only when the close confirms directional intent. The stop loss is placed at the opposite boundary, creating a predefined risk parameter before committing capital. Profit targets typically mirror the range height, thus establishing a mechanical exit that removes emotional decision-making from live positions. Successful trading is not about predicting which direction the price will move. Instead, it involves responding to what has already happened by following momentum revealed through actual transaction data rather than speculation.
What constitutes a breakout?
A breakout happens when a candle closes outside the established range, not just when the price briefly touches a level and then pulls back. This difference helps eliminate most false signals because closing prices show where buyers and sellers actually agreed to trade, rather than where they just tested and turned away from levels. For example, if your opening range high is $150.25, you need a full-candle close at $150.26 or higher before considering a long entry. A wick that reaches $150.40 but closes at $150.20 is not a breakout; it shows a rejection.
How does volume confirmation help?
Volume confirmation adds a second layer of validation. According to the Gold ORB Strategy, which uses a 15-minute observation period, breakouts with volume above the recent average exhibit significantly higher follow-through rates. It's important to look for participation, not just price movement. When volume goes up as the price breaks the range, it shows that many market participants see the same opportunity and are putting money in the same direction.
Should you consider the broader market context?
Some traders consider the broader market context when making decisions. If S&P 500 futures show bullish momentum and your stock's opening range is above the previous day's, focusing only on long trades above the opening-range high helps reduce conflicting signals. By aligning your directional bias with the larger trend, you avoid betting against the prevailing current. While this method doesn't guarantee success, it does simplify the decision-making process by filtering out less favorable trades.
What is the risk of entering early?
The temptation to enter early destroys more ORB traders than any other mistake. As the price approaches the range boundary and momentum is strong, waiting for the close can feel like missing out on money. However, this impatience changes a mechanical system into a discretionary gamble. The edge comes from the close, not from guessing whether the close will happen.
How to structure your stop loss?
Your stop loss defines your maximum risk before you enter a trade. This is better than waiting to react after the price moves against you. There are three main approaches that traders use to set up this protection. Each approach seeks to balance the risk the trader can take with how often they get stopped out.
What is the conservative method for stop loss?
The conservative method places your stop at the range's upper boundary. If you enter long on a break above $150.25 and the range low is $148.25, your stop is $148.20. This approach allows the trade to change by $2.00, creating a 1:1 risk-reward ratio if you aim for the range height. While this method helps you handle more volatility, it also means you're risking more money on each trade.
What about the moderate approach?
The moderate approach uses the midpoint of the range as the stop level. In the $148.25 to $150.25 range, the stop is set close to $149.25. This method limits risk to $1.00 while aiming for $2.00, making a 1:1.5 ratio. Because of this, you'll experience more frequent stop-outs due to normal market noise; however, this also improves capital efficiency.
What is the aggressive structure for stop loss?
The aggressive structure sets stops just inside the entry point. For example, if entering at $150.30, a stop might be placed at $150.10. This means you are risking $0.20 to potentially make $2.00, creating a 1:10 ratio that seems appealing at first glance. However, it becomes clear how often intraday volatility can hit such a tight stop. This strategy only works if you accept that most trades will stop out, as you are mainly looking for the occasional runner that never looks back.
When should you adjust your approach?
Market conditions should decide which approach to use, not emotions from recent trades. When volatility is high, as indicated by an expanded ATR or a busy news calendar, it is smart to use wider stops. This strategy helps to avoid being shaken out by normal price swings. On the other hand, during quiet periods, using tighter stops is often better, as real breakouts tend to move smoothly with little retracement.
What is the role of position sizing?
Position sizing determines whether a series of losses has a big effect on your account or just shows normal statistical variance. It is important to risk only 1% of your total capital per trade, and never exceed that. For example, if you're trading a $50,000 account, that means your maximum risk per position is $500. If the stop distance is $1.00, you can trade 500 shares; however, if the stop distance is $2.00, you can only trade 250 shares. The stop distance ultimately controls your position size, not your personal opinion about how favorable the setup looks.
How do funded trading programs evaluate traders?
Most funded trading programs focus on traders' ability to follow risk parameters rather than just their win rate. AquaFunded offers access to capital of up to $4M, but to obtain this access, traders must consistently demonstrate they manage risk well across many trades. Their instant funding model rewards traders who can successfully use strategies like ORB while also sticking to drawdown limits. Protecting capital is more important than just chasing profits. A trader's skill is shown in how they size their positions and set their stops, not just in how often they win.
What profit targets should you aim for?
The opening range height gives a baseline profit target. A $2.00 range means you should aim for $2.00 from where you entered, balancing risk and reward. This mechanical approach helps eliminate the confusion that often occurs from deciding whether to take profits now or hold out for more. The choice is made before you enter the trade.
What alternative frameworks exist for targets?
Technical levels give us a different way to set targets. Previous swing highs, support and resistance zones, or Fibonacci extensions can provide useful exit points based on where price has had trouble advancing in the past. For example, if a target based on range height is $152.25 but a major resistance level is at $151.80, exiting at $151.80 recognizes that the price might stop there, regardless of the original plan.
How to use Average True Range for targets?
The Average True Range indicator adjusts targets based on the market's volatility. According to the Gold ORB Strategy, which uses a 5-minute entry timeframe, ATR multiples adjust profit goals to match the asset's usual movement. For instance, if the 14-day ATR shows $3.50, aiming for 1.5 times that ($5.25) falls within the asset's normal price range. This method ensures that targets are not random but instead match the market's existing volatility.
What are trailing stops and their benefits?
Trailing stops help traders take advantage of big moves without giving up on their first goals. Set your main target at 1x the range height. Once the price goes up 50% of that distance in your favor, move your stop to breakeven. If the price keeps moving up, you secure your profits while still being ready for more action. If the price goes down, you can leave without losing money.
When to consider time-based exits?
Time-based exits address a problem that many traders overlook. ORB setups gain their advantage from early-session momentum. If a trade hasn’t reached its target within the first two hours, the directional bias that started the breakout likely fades. Holding positions into the midday chop changes a momentum trade into a hope-based position. It is often better to exit and wait for the next session.
How to add confirmation layers to ORB?
The basic ORB framework is effective, but adding confirmation layers can help reduce false breakouts while still capturing valid signals. The key is to choose indicators that capture different aspects of price behavior, rather than using repeated signals that convey the same information.
What role does ATR play in entry?
ATR filters out sessions with low volatility, as breakouts lack sufficient energy to continue. Set a minimum level: only take ORB trades when the current ATR exceeds its 20-day average. This helps ensure the market has enough movement potential to make the risk worthwhile. During times of low volatility, even valid breakouts can often stop quickly. This happens because there is not enough participation to keep the momentum going.
How to confirm momentum with RSI?
Momentum confirmation through RSI prevents counter-trend trades. For long positions, make sure the RSI is above 50 and rising. For short positions, ensure the RSI is below 50 and falling. This simple check helps align entry with the current momentum direction, filtering out breakouts that go against the prevailing bias. The focus is not on predicting reversals, but on following strength.
How do you combine indicators effectively?
Combining momentum indicators with volatility-adjusted channels makes a multi-dimensional filter. Keltner Channels change their width based on Average True Range (ATR). This helps determine whether the price is trending or moving sideways. Breakouts occur when the price is near the channel's upper or lower edge. When these breakouts are confirmed by the RSI, they show stronger follow-through than breakouts that occur in range-bound conditions within the channels.
What are the risks of using too many indicators?
The danger of using indicators comes from adding too many. Each filter you add reduces the sample size, making it harder to detect whether an edge actually exists. Use no more than 3 indicators: one for volatility, one for momentum, and one for trend context. If you go over this number, it can lead to over-optimization, where strategies are adjusted to past data rather than built to withstand future uncertainty.
How can a moving-average filter be used to trade?
A 20-period exponential moving average acts as a trend filter while keeping things simple. Traders should only look for long breakouts when the price is above the EMA. On the other hand, short breakouts should only happen when the price is below it. This method helps avoid going against the broader trend, thereby increasing the chances of successful trades. However, it might lead to fewer trades overall.
How to handle failures in your strategies?
Knowing which indicators to use doesn't solve the hardest part: what to do when a carefully filtered setup fails. You then face the tough choice of deciding whether the strategy has failed or if you made a mistake. When navigating challenges like these, our funded trading program can provide the support you need to recover and refine your approach.
Risk Management in the ORB Strategy Trading

Position sizing protects your account when breakouts go the other way. Stop losses help prevent big losses when momentum fades. Volume filters lower your risk of weak signals that can trick impulsive traders. These three factors determine whether the ORB strategy becomes a consistent income tool or another system that gets left behind after losing money. The main reason most ORB attempts fail isn't about when to enter or which indicators to use; it's about risking too much money on each trade just because a setup looks good.
According to LuxAlgo's analysis of ORB implementation, professional traders risk 1-2% of their account on each trade, regardless of their confidence level. This method creates mathematical resilience; for example, ten losses in a row with 2% risk leave 82% of your money intact, while ten losses at 10% risk can wipe out your account. To figure out your position size, first find your stop distance; do not do this the other way around. If your account has $25,000 and you want to risk 2% ($500), measure the space between your entry and stop. A $1.25 stop distance lets you buy 400 shares, while a $0.50 stop distance allows for 1,000 shares. So, the market's ups and downs decide how many shares you can buy, not your thoughts about how good the trade is.
This approach changes how most traders think. They usually pick how many shares they want to trade, then decide where to place the stop. This order of actions exposes the system to significant risks during unpredictable times, when stop distances increase. Good position sizing makes traders take smaller positions when volatility goes up, which is exactly when they should lower their exposure.
Where should your stop be placed?
Your stop should be set where your direction plan fails, not just at some random percentage below your entry point. For long positions above the opening range, the invalidation point is just below the low of that range. If the price moves back into the range strongly enough to close that line, the breakout has failed. Keeping the position past that point turns a planned trade into a hope-based gamble.
The exact spot for your stop depends on how much the asset typically moves. Very liquid stocks with small price differences can use stops 5-10 cents beyond the range boundary. On the other hand, volatile crypto pairs might need a $2-3 buffer to prevent being stopped out by normal price swings. To find this, look at the Average True Range (ATR) for the last 14 periods. For instance, if the current ATR is $1.80, placing your stop $0.20 beyond the range will likely lead to early exits, as it doesn't account for the market's typical movement.
How to manage your stops during trading?
Time-based stop adjustments solve a problem fixed stops create. The opening range shows what prices do in the first 15 to 30 minutes of trading. After about two hours, that range becomes less important as new information enters the market. If your position hasn't reached its target within 90 minutes, consider trailing your stop to breakeven or slightly better. You're realizing that the reasons for the initial price boost have faded, so it's not wise to keep risking all your money.
Why is volume important during trading?
Price can break any level, but what matters is whether that break has the conviction of many participants orcomes from a single large order that won't last. Volume expansion during the breakout candle shows real interest, while volume contraction suggests the move lacks support and will likely reverse. To evaluate this well, compare the breakout candle's volume to the average volume of the previous 20 candles. It's wise to look for at least 150% of that average before thinking about making an entry. This simple check helps to filter out breakouts caused by low liquidity or algorithmic noise. The aim is to wait for proof that the market supports the directional move, not just to see that the price reached a level.
How to confirm breakout signals?
Retracements after the initial breakout provide a second chance to confirm. When the price breaks out of the range and then pulls back toward the boundary without crossing it, the original direction continues. This pattern shows that the breakout level now acts as support for buyers or resistance for sellers. Entering on the second push rather than the initial break reduces the risk of false signals because it confirms that the level holds. Economic news, earnings reports, and global events create price movements that can overshadow technical levels. A well-placed stop at the low of the range may not matter if a surprise Fed decision causes a 3% gap down in seconds. The disciplined approach isn't just about setting tighter stops or wider targets; it's about avoiding ORB trades completely on known event days.
What to do during unexpected news?
Unexpected news during a trading session requires immediate management of positions. If someone is holding an ORB trade and breaking news happens, they should exit at the current price without waiting for their target or stop. The risk profile has changed in ways that the original plan didn't expect. So, protecting capital is more important than finishing the trade according to the initial plan.
How to maintain capital in funded trading programs?
Most funded trading programs focus more on risk management than on profit-making. AquaFunded offers access to up to $4M in capital, but to keep that access, you need to show that you can control your drawdowns consistently across different trades. Their instant funding model rewards traders who protect their capital during tough times instead of chasing profits when things get chaotic. You are showing that you know when not to trade, which is more important than knowing when to enter.
The 1-minute chart shows a clear closing above the opening range, while the 5-minute chart shows a candle wick that only slightly touched the level. These conflicting signals often occur because different timeframes reveal different information. Getting confirmation on your entry timeframe, along with one higher timeframe, helps to reduce entries on moves that are not strong.
Why confirm on multiple timeframes?
When trading breakouts on a 1-minute chart after seeing a 15-minute opening range, it is important to check that the 5-minute chart also shows a close beyond the boundary. You do not need to wait for a 5-minute candle to finish; instead, you just need to verify that the current 5-minute candle, even if it is still going, shows price trading decisively beyond the range instead of staying at the edge.
Momentum indicators on the higher time frame provide an extra layer of confirmation. For example, an RSI above 60 on the 5-minute chart while the price breaks the range on the 1-minute chart shows that the move has strength beyond the immediate breakout candle. This method is about stacking probabilities: a confirmed close, agreement from the higher time frame, and momentum confirmation. Using these filters may reduce the number of trades, but they greatly improve the quality of the signals acted on.
How to allocate capital effectively?
Not every ORB setup deserves the same amount of capital. A breakout that occurs with volume expansion and momentum confirmation, and that is in line with the larger market trend, deserves a larger position size within your risk limits. On the other hand, a breakout that just meets the basic requirements deserves a smaller size, even if it technically qualifies.
Make a scoring system to assess setups. Give one point for volume above 150% of average; one point for the RSI confirming direction; one point for price being above (for longs) or below (for shorts) the 20-period EMA; and one point for the larger market moving in your direction. A setup that scores 4/4 gets your full 2% risk allocation. A setup that scores 2/4 receives 1% risk. Any setup scoring 1/4 or less gets skipped completely.
How does a systematic approach help?
A systematic approach removes emotional decision-making from position sizing. Traders don’t increase their trades just because they "feel good" about a setup, and they don’t reduce their size because of a previous loss. Instead, they follow objective criteria that align with higher-probability outcomes. Over hundreds of trades, this rule leads to significantly better risk-adjusted returns. Even with perfect risk management, a major challenge remains: raising enough capital to make ORB trading worthwhile without risking all one's savings while learning.
Related Reading
- Sources of Capital
- Cash Reserve Account
- Short Term Stock Trading
- Investment Performance Analysis
- Managed Account vs Brokerage Account
- Systematic Trading
- How to Analyze a Stock Before Buying
- Forex Capital Trading
- What is a Retracement in Trading
- How is Risk Involved in Calculating Profit?
- Convergence Trading
- Liquidity Trading
- Futures Trading Minimum Account Size
- What is Drawdown in Trading
Trade the Market Open Without Risking Your Own Capital
ORB strategy trading needs precision during the most active part of the day. Putting personal money at risk, especially during false breakouts, can lead to big losses fast. AquaFunded lets traders use their Opening Range Breakout strategy on funded accounts of up to $400K. This means that early-session volatility can help traders rather than hurt them. With no time limits, flexible drawdown rules, and up to a 100% profit split, traders can concentrate on executing clear ORB setups without always worrying about protecting their savings.
Over 42,000 traders have made more than $2.9M, thanks to AquaFunded's 48-hour payout guarantee. Trade the open with confidence using institutional capital instead of your own. Your skills become the asset, and their capital is the tool. This setup means the learning curve won’t cost you money you can’t afford to lose. Join the funded trading program today.
Related Reading
- How To Take Profits From Stocks
- Accumulation Distribution
- Short-Term Capital Gain Tax On Shares
- What Is Reit Dividends
- Cash Available To Trade Vs Settled Cash
- Best Pairs To Trade Forex
- Can You Day Trade In A Roth Ira
- What Is A Conditional Order
- Stop Loss Vs Stop Limit
- Flag Pattern Trading
- Characteristics of Growth Stocks
- Forex Compounding Plan
